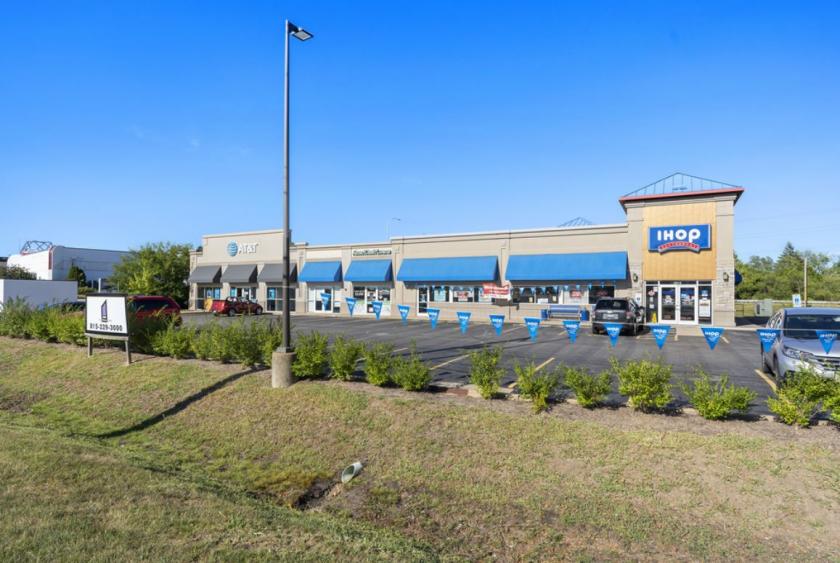
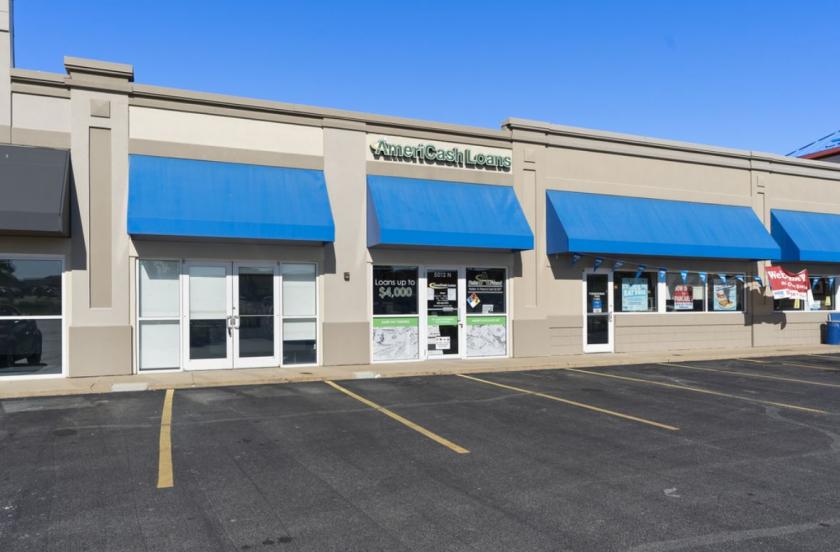
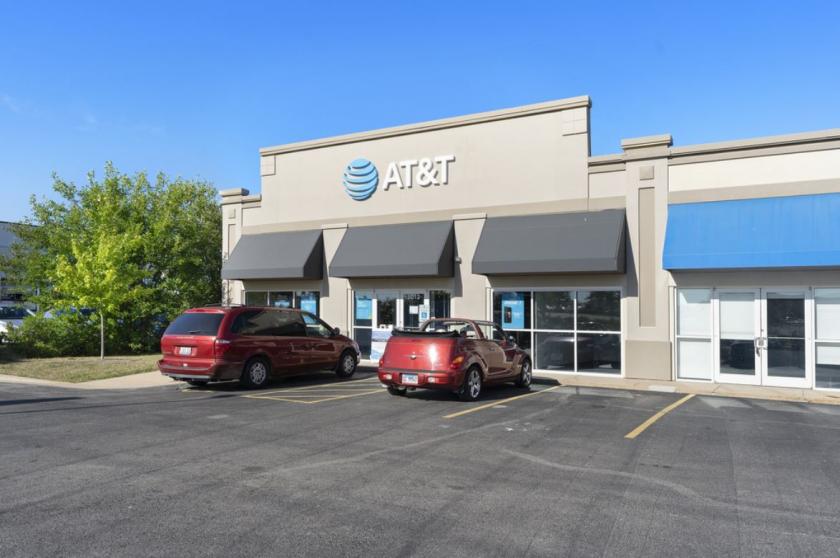
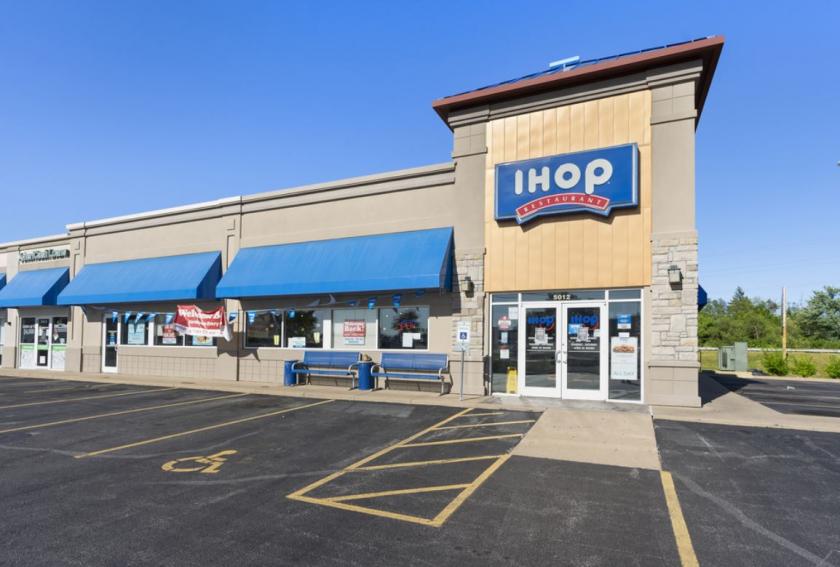
1-Mile | 3-Miles | 5-Miles | ||
---|---|---|---|---|
Total Population | 7,391 | 59,424 | 122,794 | |
Population Median Age | 42 | 40 | 38 | |
Population by Age | 0-9 Yrs | 815 (11%) | 7516 (12%) | 16424 (13%) |
10-19 Yrs | 779 (10%) | 6351 (10%) | 15097 (12%) | |
20-29 Yrs | 761 (10%) | 7680 (12%) | 19337 (15%) | |
30-39 Yrs | 1174 (15%) | 9005 (15%) | 16744 (13%) | |
40-49 Yrs | 901 (12%) | 5990 (10%) | 12816 (10%) | |
50-59 Yrs | 994 (13%) | 7790 (13%) | 14879 (12%) | |
60-69 Yrs | 950 (12%) | 7232 (12%) | 13933 (11%) | |
70+ Yrs | 1018 (13%) | 7859 (13%) | 13565 (11%) | |
Median HH Income | $60,684 | $55,875 | $50,351 | |
Total Household Income | < 24K | 553 (16%) | 5807 (22%) | 13721 (27%) |
25-49K | 788 (24%) | 6061 (23%) | 11532 (22%) | |
50-74K | 689 (21%) | 5157 (19%) | 9060 (17%) | |
75-99K | 501 (15%) | 3582 (13%) | 6079 (11%) | |
100-199K | 635 (19%) | 4803 (18%) | 8274 (16%) | |
200K+ | 109 (3%) | 905 (3%) | 2130 (4%) | |
Highest Education Level | No Diploma | 339 | 3010 | 8199 |
Diploma or GED | 1303 | 9980 | 21458 | |
Some College | 1322 | 9947 | 18582 | |
Assoc. Degree | 575 | 4313 | 7746 | |
Bachelors Degree | 1489 | 9631 | 15835 | |
Higher Degree | 539 | 5648 | 10041 | |
Total Housing Units | 3,660 | 29,789 | 58,793 | |
--Owner-Occupied | 2,156 | 16,350 | 29,284 | |
--Renter-Occupied | 1,120 | 9,965 | 21,512 | |
Owner-Occupied Values | < 100K | 405 | 5727 | 12459 |
100-199K | 1548 | 7894 | 11273 | |
200-299K | 146 | 1980 | 3239 | |
300-399K | 51 | 503 | 1262 | |
400-499K | 5 | 113 | 407 | |
500K+ | 2 | 133 | 644 | |
Total Working Age Population | 6,108 | 47,994 | 97,361 | |
In Work Force | 3,744 | 29,975 | 59,626 | |
Not In Work Force | 2,364 | 18,019 | 37,736 | |
Workforce Employed | 3,587 | 27,896 | 54,364 | |
Workforce Unemployed | 155 | 2,012 | 5,181 | |
Civlian Workforce | 3,742 | 29,908 | 59,545 | |
Military Workforce | 3 | 67 | 80 | |
Total Households | 3,276 | 26,315 | 50,796 | |
Family Households | 1,693 | 13,993 | 27,625 | |
Non-Family Households | 1,583 | 12,321 | 23,171 | |
Married Couple | 1,286 | 9,986 | 18,164 | |
Other Family | 407 | 4,008 | 9,461 | |
Married w/Child | 414 | 3,491 | 6,205 | |
Single Male w/Child | 36 | 378 | 914 | |
Single Female w/Child | 154 | 1,832 | 4,623 |
Population Change Last Two Decades - Plus Projection
2000 | % | 2010 | % | 2020 | % | 2030 | |
---|---|---|---|---|---|---|---|
Illinois | 12,419,293 | +3 | 12,830,632 | +12 | 14,316,487 | +6 | 15,138,849 |
Peoria County | 183,433 | +2 | 186,494 | +4 | 194,083 | 0 | 193,314 |
Tazewell County | 128,485 | +5 | 135,394 | +14 | 154,567 | +7 | 165,373 |
Woodford County | 35,469 | +9 | 38,664 | +13 | 43,845 | +7 | 46,857 |
Total Working Age Population:
Total Households:
Total Working Age Population:
Total Households:
Total Working Age Population:
Total Households: