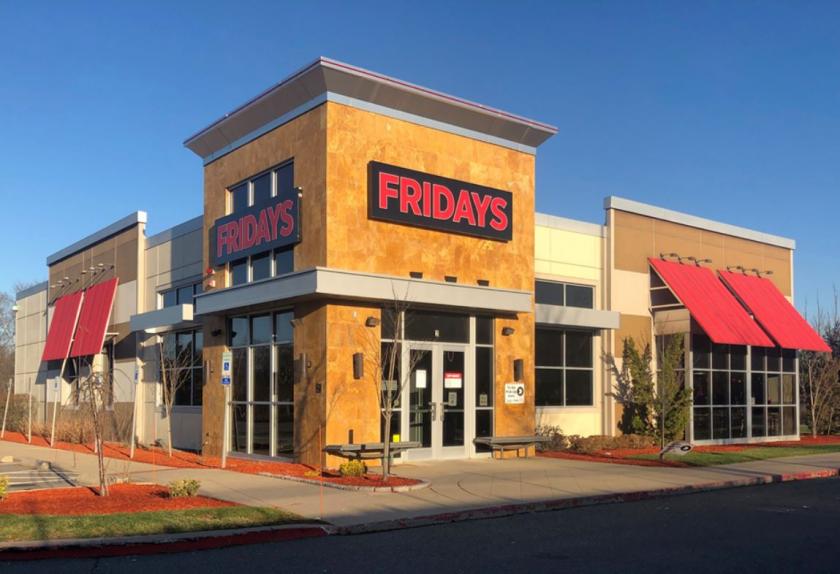
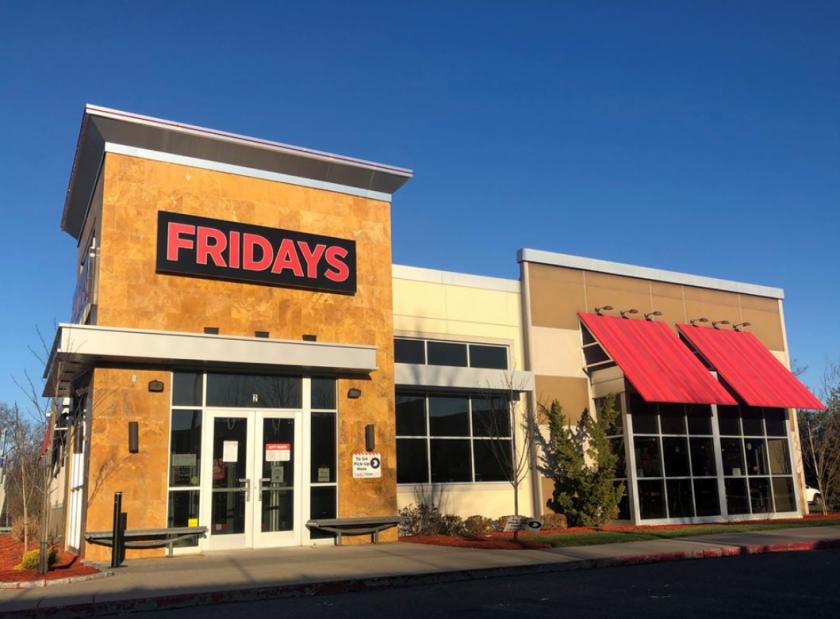
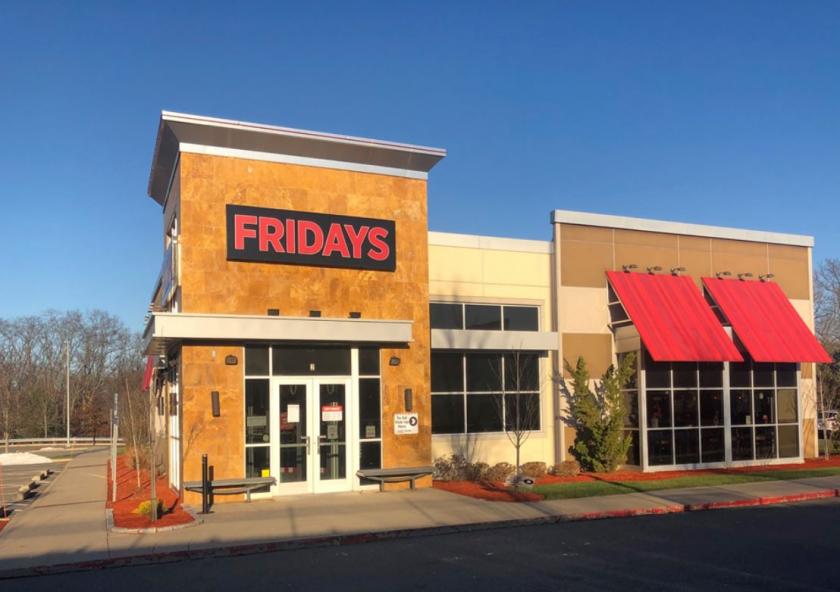
1-Mile | 3-Miles | 5-Miles | ||
---|---|---|---|---|
Total Population | 3,824 | 62,337 | 157,672 | |
Population Median Age | 42 | 41 | 41 | |
Population by Age | 0-9 Yrs | 369 (9%) | 6899 (11%) | 17375 (11%) |
10-19 Yrs | 329 (8%) | 7145 (11%) | 19827 (12%) | |
20-29 Yrs | 649 (16%) | 7859 (12%) | 18343 (11%) | |
30-39 Yrs | 398 (10%) | 7926 (12%) | 20446 (12%) | |
40-49 Yrs | 557 (14%) | 7858 (12%) | 20059 (12%) | |
50-59 Yrs | 518 (13%) | 9518 (15%) | 23595 (14%) | |
60-69 Yrs | 434 (11%) | 8267 (13%) | 19915 (12%) | |
70+ Yrs | 571 (14%) | 6865 (11%) | 18112 (11%) | |
Median HH Income | $84,824 | $81,363 | $81,679 | |
Total Household Income | < 24K | 183 (13%) | 3081 (13%) | 8722 (15%) |
25-49K | 189 (13%) | 3741 (16%) | 9514 (16%) | |
50-74K | 250 (18%) | 3783 (16%) | 8651 (15%) | |
75-99K | 169 (12%) | 2875 (12%) | 7281 (12%) | |
100-199K | 401 (29%) | 7463 (32%) | 17784 (30%) | |
200K+ | 185 (13%) | 1731 (7%) | 5714 (9%) | |
Highest Education Level | No Diploma | 383 | 4877 | 12035 |
Diploma or GED | 914 | 12830 | 30039 | |
Some College | 504 | 8169 | 19857 | |
Assoc. Degree | 284 | 4571 | 10473 | |
Bachelors Degree | 445 | 8720 | 23704 | |
Higher Degree | 369 | 5229 | 14606 | |
Total Housing Units | 1,450 | 24,001 | 60,670 | |
--Owner-Occupied | 907 | 15,139 | 39,733 | |
--Renter-Occupied | 470 | 7,536 | 17,933 | |
Owner-Occupied Values | < 100K | 15 | 363 | 1063 |
100-199K | 44 | 751 | 2499 | |
200-299K | 156 | 3961 | 9730 | |
300-399K | 303 | 5487 | 12115 | |
400-499K | 109 | 2087 | 5944 | |
500K+ | 279 | 2490 | 8381 | |
Total Working Age Population | 3,309 | 51,668 | 128,912 | |
In Work Force | 2,172 | 35,320 | 87,529 | |
Not In Work Force | 1,138 | 16,348 | 41,384 | |
Workforce Employed | 2,090 | 33,279 | 82,821 | |
Workforce Unemployed | 81 | 2,041 | 4,671 | |
Civlian Workforce | 2,172 | 35,320 | 87,492 | |
Military Workforce | 0 | 0 | 36 | |
Total Households | 1,376 | 22,675 | 57,666 | |
Family Households | 938 | 15,531 | 38,849 | |
Non-Family Households | 438 | 7,144 | 18,817 | |
Married Couple | 649 | 10,704 | 27,691 | |
Other Family | 289 | 4,827 | 11,157 | |
Married w/Child | 244 | 4,117 | 11,330 | |
Single Male w/Child | 9 | 262 | 788 | |
Single Female w/Child | 46 | 1,745 | 4,161 |
Population Change Last Two Decades - Plus Projection
2000 | % | 2010 | % | 2020 | % | 2030 | |
---|---|---|---|---|---|---|---|
Massachusetts | 6,349,097 | +3 | 6,547,629 | +6 | 6,933,887 | +4 | 7,225,472 |
Bristol County | 534,678 | +3 | 548,285 | +2 | 561,478 | +1 | 567,277 |
Middlesex County | 1,465,396 | +3 | 1,503,085 | +7 | 1,613,961 | +5 | 1,686,641 |
Norfolk County | 650,308 | +3 | 670,850 | +7 | 718,394 | +7 | 765,912 |
Plymouth County | 472,822 | +5 | 494,919 | +5 | 518,508 | +3 | 534,464 |
Total Working Age Population:
Total Households:
Total Working Age Population:
Total Households:
Total Working Age Population:
Total Households: