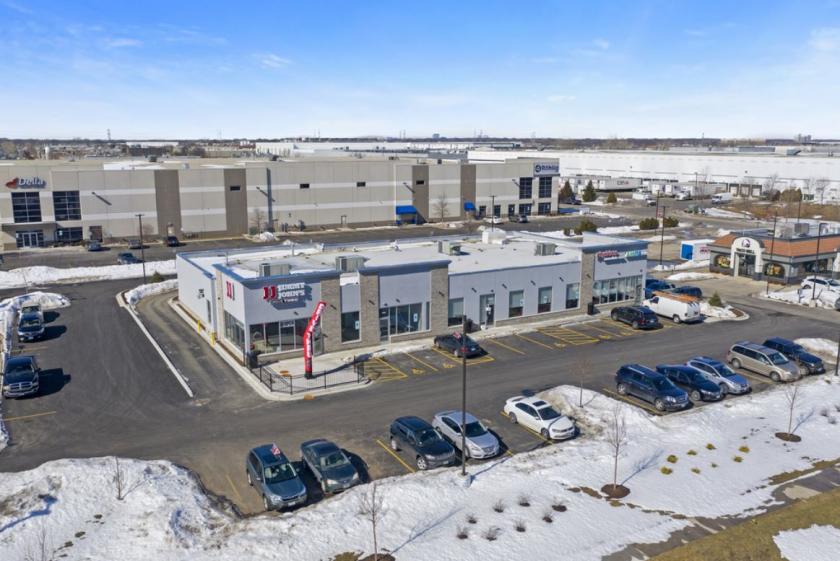
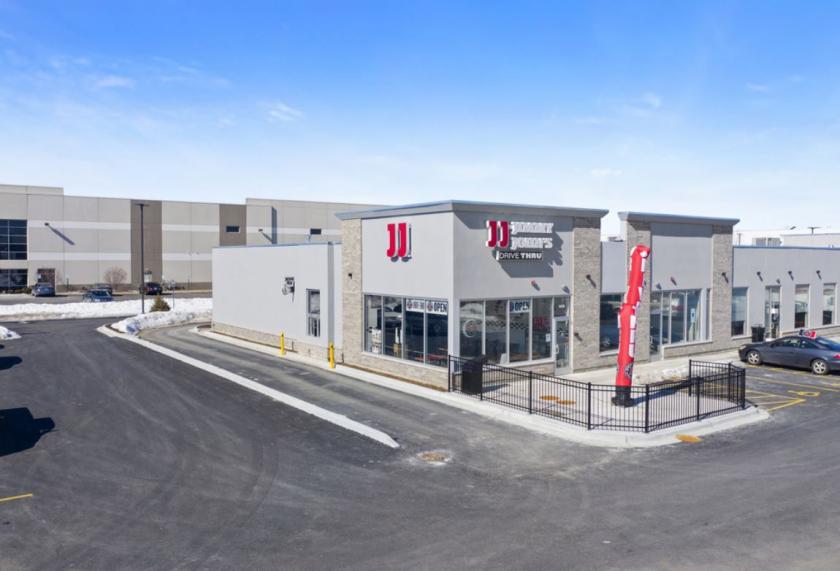
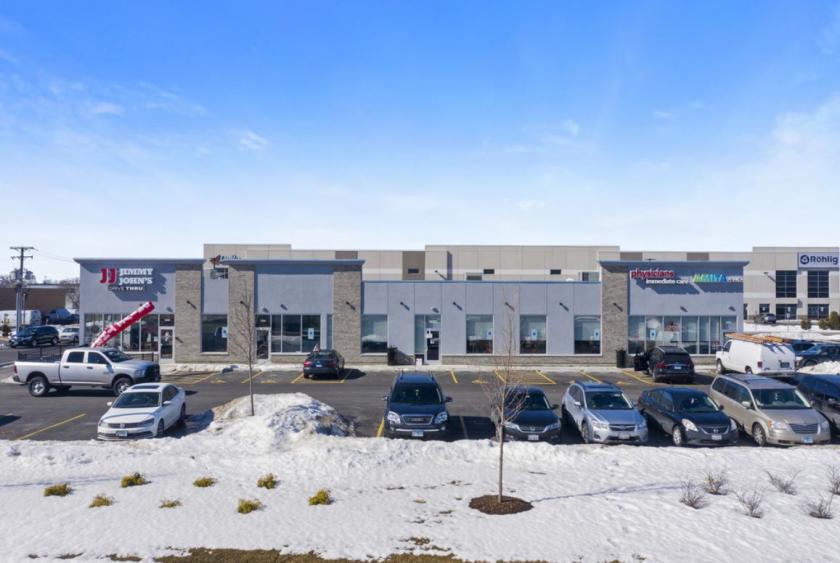
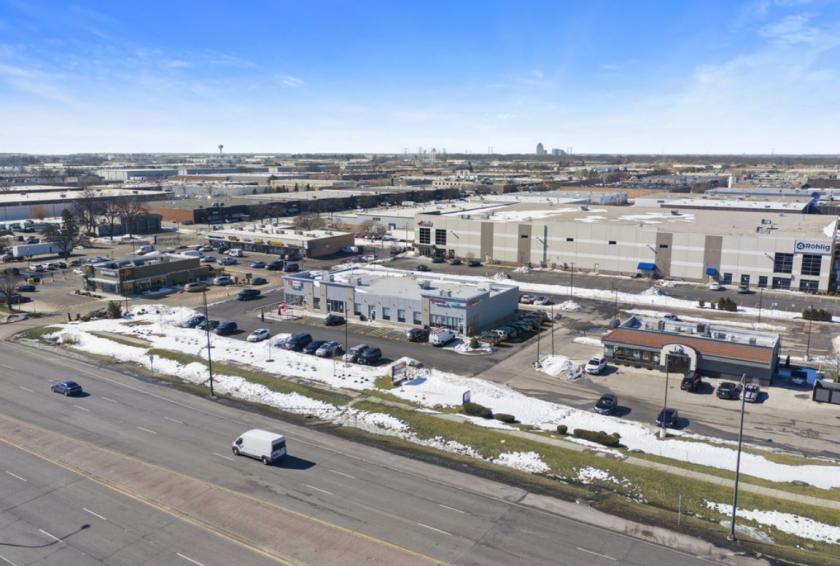
1-Mile | 3-Miles | 5-Miles | ||
---|---|---|---|---|
Total Population | 2,134 | 62,909 | 218,869 | |
Population Median Age | 43 | 39 | 40 | |
Population by Age | 0-9 Yrs | 108 (5%) | 8348 (13%) | 25757 (11%) |
10-19 Yrs | 269 (12%) | 7025 (11%) | 24770 (11%) | |
20-29 Yrs | 243 (11%) | 8052 (12%) | 26148 (11%) | |
30-39 Yrs | 223 (10%) | 9872 (15%) | 30866 (14%) | |
40-49 Yrs | 457 (21%) | 8720 (13%) | 28647 (13%) | |
50-59 Yrs | 329 (15%) | 7803 (12%) | 30392 (13%) | |
60-69 Yrs | 247 (11%) | 6513 (10%) | 25845 (11%) | |
70+ Yrs | 257 (12%) | 6576 (10%) | 26444 (12%) | |
Median HH Income | $65,786 | $65,067 | $73,846 | |
Total Household Income | < 24K | 89 (9%) | 3529 (14%) | 10982 (13%) |
25-49K | 260 (28%) | 5366 (22%) | 16148 (19%) | |
50-74K | 173 (18%) | 4861 (20%) | 15363 (18%) | |
75-99K | 138 (14%) | 3544 (14%) | 11900 (14%) | |
100-199K | 223 (24%) | 5312 (22%) | 22705 (27%) | |
200K+ | 40 (4%) | 1099 (4%) | 6542 (7%) | |
Highest Education Level | No Diploma | 295 | 6816 | 18394 |
Diploma or GED | 393 | 11978 | 38551 | |
Some College | 431 | 9144 | 29931 | |
Assoc. Degree | 123 | 2932 | 12619 | |
Bachelors Degree | 262 | 9198 | 37303 | |
Higher Degree | 166 | 3960 | 19848 | |
Total Housing Units | 1,007 | 25,337 | 88,648 | |
--Owner-Occupied | 567 | 13,508 | 56,812 | |
--Renter-Occupied | 356 | 10,203 | 26,828 | |
Owner-Occupied Values | < 100K | 50 | 1845 | 4245 |
100-199K | 134 | 2716 | 11384 | |
200-299K | 305 | 4924 | 18253 | |
300-399K | 58 | 2964 | 14074 | |
400-499K | 3 | 613 | 5021 | |
500K+ | 16 | 446 | 3835 | |
Total Working Age Population | 1,853 | 50,148 | 177,803 | |
In Work Force | 1,299 | 35,145 | 122,227 | |
Not In Work Force | 553 | 15,003 | 55,576 | |
Workforce Employed | 1,240 | 33,463 | 117,122 | |
Workforce Unemployed | 45 | 1,653 | 5,042 | |
Civlian Workforce | 1,286 | 35,116 | 122,164 | |
Military Workforce | 13 | 29 | 63 | |
Total Households | 923 | 23,710 | 83,641 | |
Family Households | 576 | 15,870 | 56,000 | |
Non-Family Households | 347 | 7,841 | 27,641 | |
Married Couple | 417 | 12,080 | 44,343 | |
Other Family | 159 | 3,790 | 11,657 | |
Married w/Child | 111 | 5,207 | 17,938 | |
Single Male w/Child | 60 | 432 | 1,469 | |
Single Female w/Child | 24 | 1,250 | 3,669 |
Population Change Last Two Decades - Plus Projection
2000 | % | 2010 | % | 2020 | % | 2030 | |
---|---|---|---|---|---|---|---|
Illinois | 12,419,293 | +3 | 12,830,632 | +12 | 14,316,487 | +6 | 15,138,849 |
Cook County | 5,376,741 | -3 | 5,194,675 | +10 | 5,707,832 | +5 | 5,990,243 |
DuPage County | 904,161 | +1 | 916,924 | +10 | 1,010,323 | +2 | 1,034,039 |
Total Working Age Population:
Total Households:
Total Working Age Population:
Total Households:
Total Working Age Population:
Total Households: