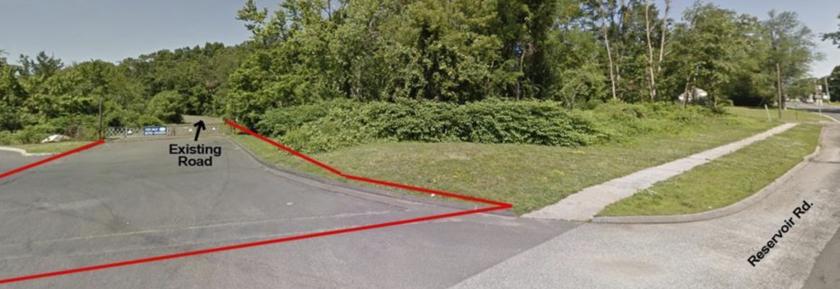
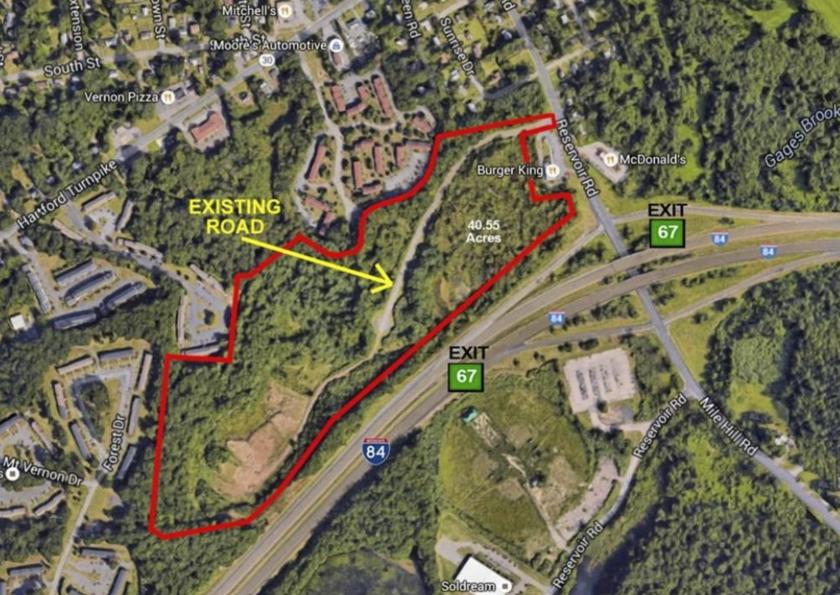
1-Mile | 3-Miles | 5-Miles | ||
---|---|---|---|---|
Total Population | 4,827 | 30,304 | 62,975 | |
Population Median Age | 37 | 39 | 40 | |
Population by Age | 0-9 Yrs | 660 (13%) | 3760 (12%) | 6891 (10%) |
10-19 Yrs | 472 (9%) | 3201 (10%) | 7582 (12%) | |
20-29 Yrs | 936 (19%) | 4922 (16%) | 8658 (13%) | |
30-39 Yrs | 825 (17%) | 4290 (14%) | 8088 (12%) | |
40-49 Yrs | 402 (8%) | 3462 (11%) | 7913 (12%) | |
50-59 Yrs | 549 (11%) | 4131 (13%) | 9257 (14%) | |
60-69 Yrs | 435 (9%) | 3093 (10%) | 7402 (11%) | |
70+ Yrs | 549 (11%) | 3445 (11%) | 7184 (11%) | |
Median HH Income | $61,587 | $69,482 | $83,610 | |
Total Household Income | < 24K | 428 (20%) | 2036 (15%) | 3442 (13%) |
25-49K | 460 (21%) | 2701 (21%) | 4225 (16%) | |
50-74K | 425 (19%) | 2188 (17%) | 4054 (15%) | |
75-99K | 284 (13%) | 1746 (13%) | 3592 (13%) | |
100-199K | 461 (21%) | 3309 (25%) | 7875 (30%) | |
200K+ | 78 (3%) | 840 (6%) | 2729 (10%) | |
Highest Education Level | No Diploma | 297 | 1263 | 2081 |
Diploma or GED | 999 | 6788 | 12120 | |
Some College | 691 | 3991 | 7582 | |
Assoc. Degree | 294 | 1743 | 4027 | |
Bachelors Degree | 531 | 4308 | 10812 | |
Higher Degree | 471 | 2853 | 7681 | |
Total Housing Units | 2,216 | 13,661 | 27,502 | |
--Owner-Occupied | 935 | 7,189 | 16,887 | |
--Renter-Occupied | 1,201 | 5,632 | 9,031 | |
Owner-Occupied Values | < 100K | 123 | 496 | 957 |
100-199K | 385 | 2641 | 4562 | |
200-299K | 317 | 2676 | 6485 | |
300-399K | 58 | 764 | 2846 | |
400-499K | 26 | 359 | 1143 | |
500K+ | 26 | 253 | 894 | |
Total Working Age Population | 3,865 | 24,602 | 51,315 | |
In Work Force | 2,634 | 17,291 | 35,703 | |
Not In Work Force | 1,231 | 7,311 | 15,612 | |
Workforce Employed | 2,489 | 16,028 | 33,521 | |
Workforce Unemployed | 136 | 1,211 | 2,083 | |
Civlian Workforce | 2,625 | 17,239 | 35,605 | |
Military Workforce | 9 | 52 | 98 | |
Total Households | 2,136 | 12,821 | 25,917 | |
Family Households | 1,114 | 7,488 | 16,159 | |
Non-Family Households | 1,022 | 5,333 | 9,758 | |
Married Couple | 720 | 5,360 | 12,891 | |
Other Family | 394 | 2,128 | 3,267 | |
Married w/Child | 314 | 2,110 | 5,128 | |
Single Male w/Child | 74 | 221 | 455 | |
Single Female w/Child | 171 | 1,041 | 1,414 |
Population Change Last Two Decades - Plus Projection
2000 | % | 2010 | % | 2020 | % | 2030 | |
---|---|---|---|---|---|---|---|
Connecticut | 3,405,565 | +5 | 3,574,097 | +1 | 3,604,603 | +1 | 3,633,994 |
Hartford County | 857,183 | +4 | 894,014 | +2 | 909,671 | +2 | 930,629 |
Tolland County | 136,364 | +12 | 152,691 | +3 | 156,588 | -1 | 155,697 |
Total Working Age Population:
Total Households:
Total Working Age Population:
Total Households:
Total Working Age Population:
Total Households: