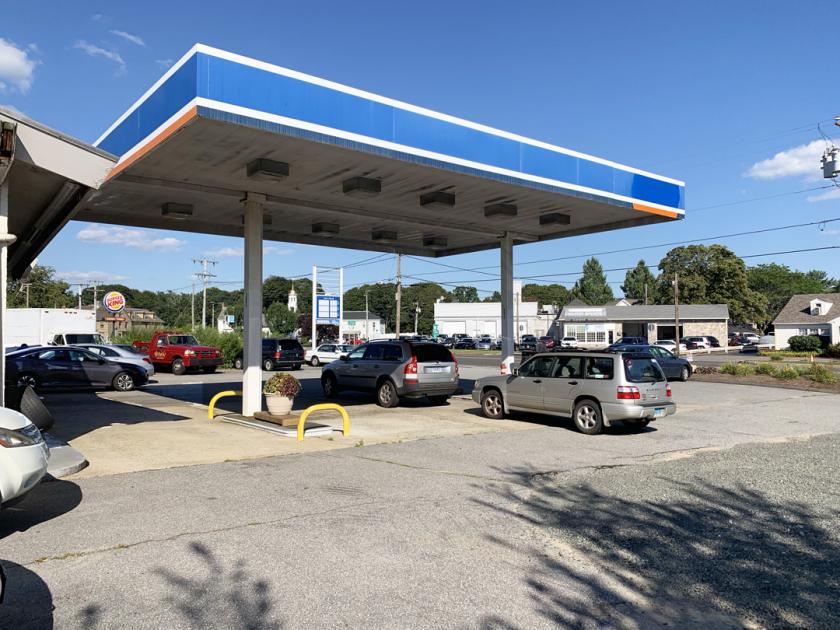
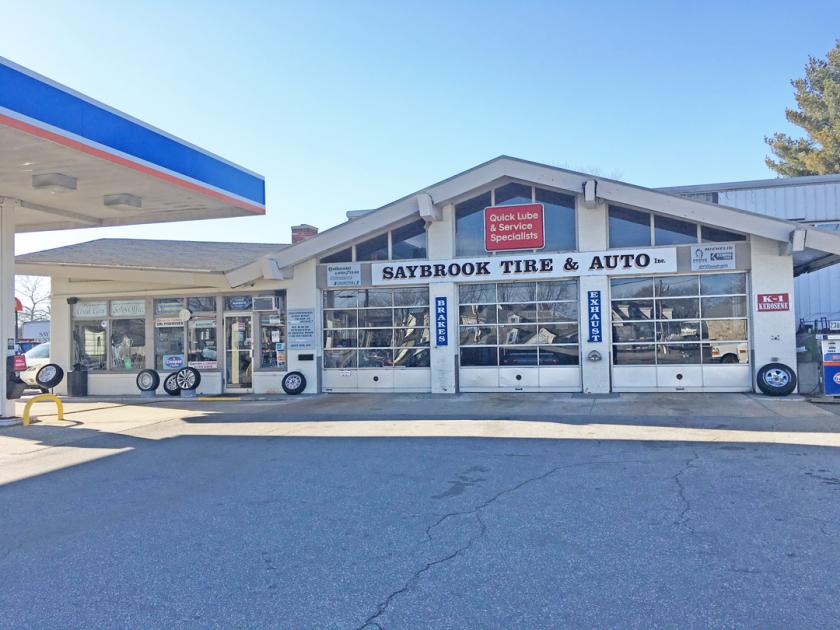
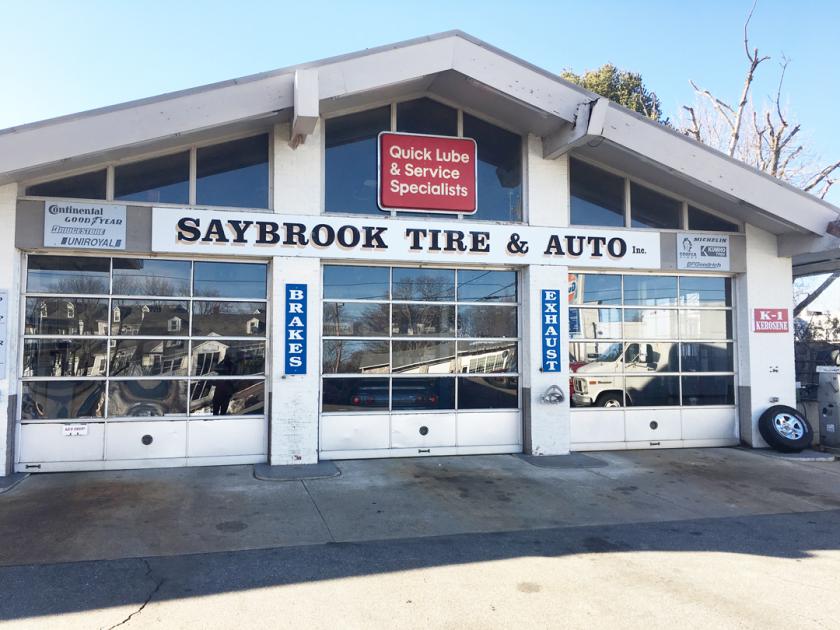
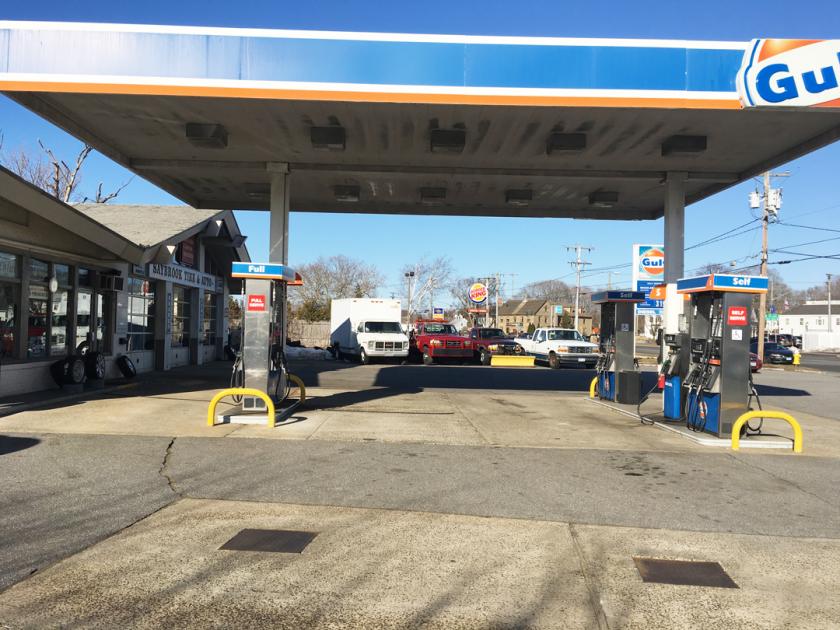
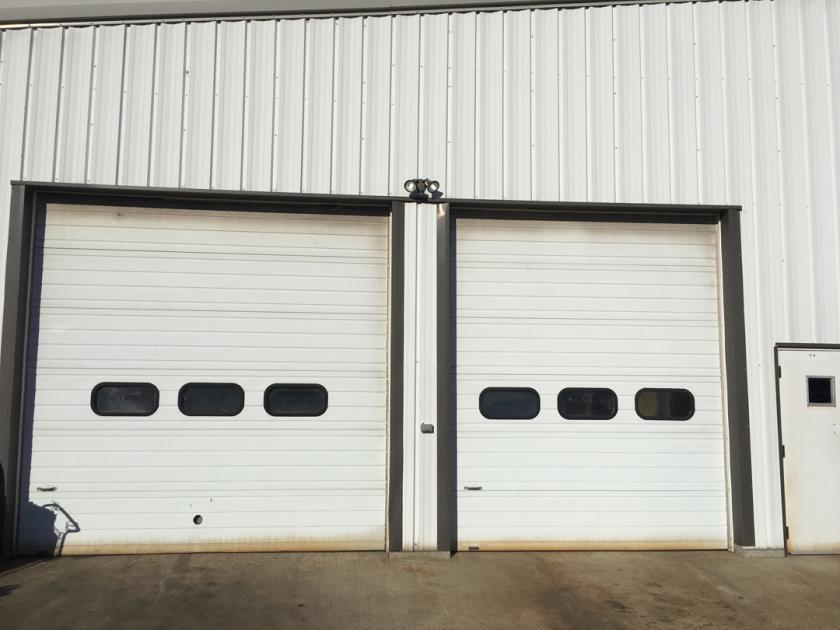
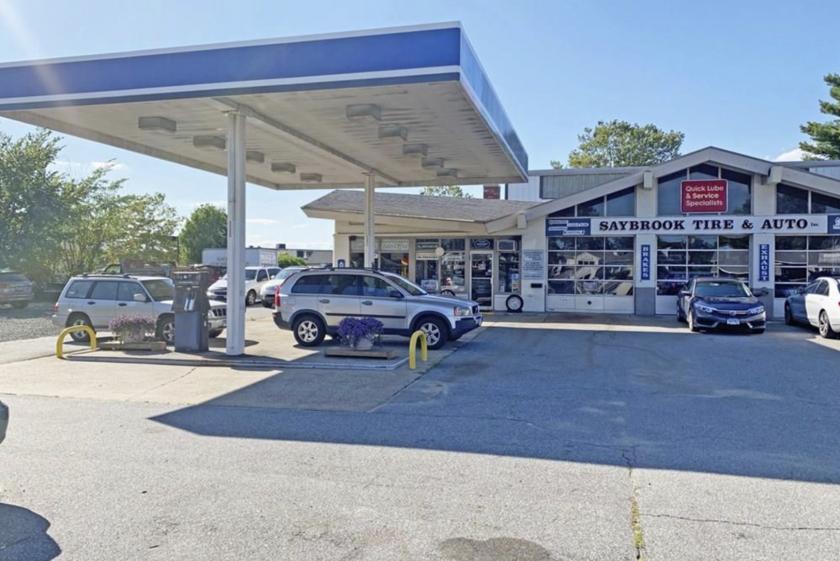
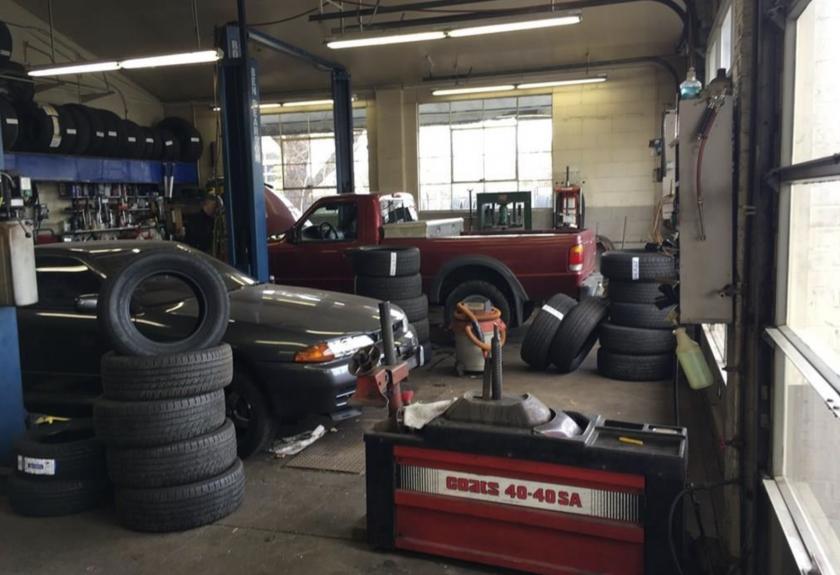
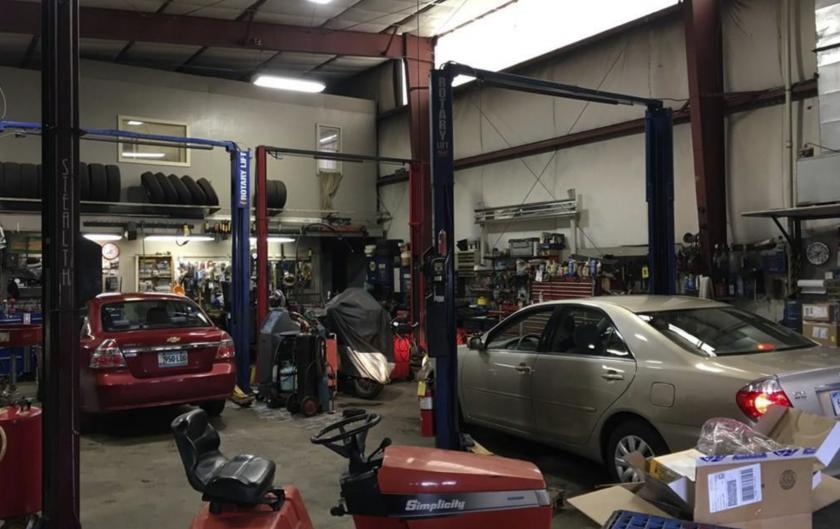
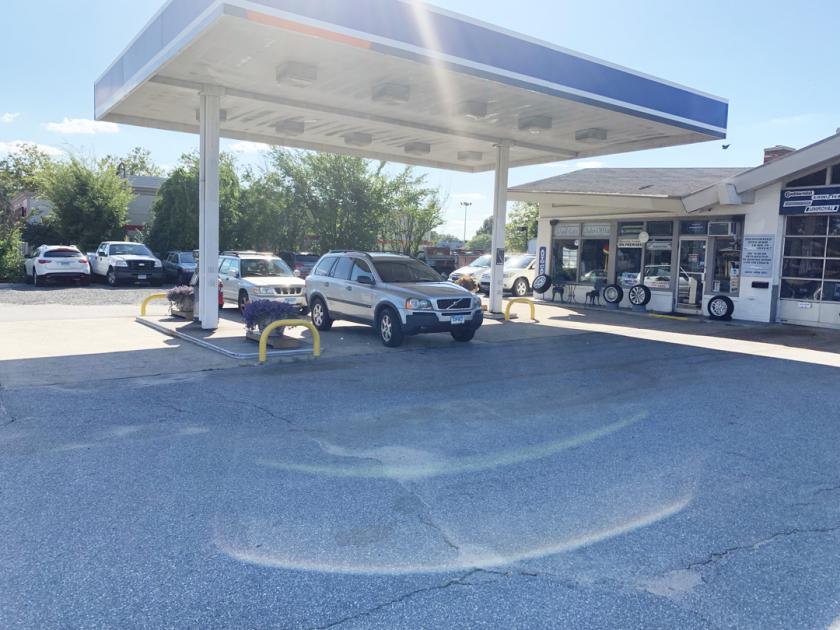
1-Mile | 3-Miles | 5-Miles | ||
---|---|---|---|---|
Total Population | 2,789 | 18,787 | 37,082 | |
Population Median Age | 45 | 51 | 50 | |
Population by Age | 0-9 Yrs | 277 (9%) | 1192 (6%) | 1930 (5%) |
10-19 Yrs | 334 (11%) | 1688 (8%) | 3688 (9%) | |
20-29 Yrs | 257 (9%) | 1582 (8%) | 2560 (6%) | |
30-39 Yrs | 212 (7%) | 1195 (6%) | 2734 (7%) | |
40-49 Yrs | 408 (14%) | 1886 (10%) | 3971 (10%) | |
50-59 Yrs | 410 (14%) | 3273 (17%) | 7398 (19%) | |
60-69 Yrs | 392 (14%) | 3321 (17%) | 6334 (17%) | |
70+ Yrs | 499 (17%) | 4650 (24%) | 8468 (22%) | |
Median HH Income | $63,957 | $95,049 | $92,590 | |
Total Household Income | < 24K | 177 (14%) | 833 (9%) | 2208 (13%) |
25-49K | 293 (23%) | 1338 (15%) | 2714 (16%) | |
50-74K | 290 (23%) | 1154 (13%) | 1994 (11%) | |
75-99K | 164 (13%) | 1143 (13%) | 2089 (12%) | |
100-199K | 206 (16%) | 2859 (33%) | 4775 (28%) | |
200K+ | 123 (9%) | 1156 (13%) | 2993 (17%) | |
Highest Education Level | No Diploma | 64 | 572 | 1325 |
Diploma or GED | 548 | 3227 | 5763 | |
Some College | 368 | 2293 | 4422 | |
Assoc. Degree | 194 | 1510 | 2967 | |
Bachelors Degree | 514 | 3795 | 8142 | |
Higher Degree | 449 | 3747 | 7400 | |
Total Housing Units | 1,392 | 12,862 | 25,772 | |
--Owner-Occupied | 823 | 6,889 | 13,149 | |
--Renter-Occupied | 430 | 1,595 | 3,624 | |
Owner-Occupied Values | < 100K | 7 | 117 | 392 |
100-199K | 20 | 160 | 637 | |
200-299K | 123 | 1215 | 2161 | |
300-399K | 314 | 1869 | 3209 | |
400-499K | 116 | 1116 | 2195 | |
500K+ | 244 | 2412 | 4554 | |
Total Working Age Population | 2,342 | 16,738 | 33,039 | |
In Work Force | 1,526 | 10,140 | 20,077 | |
Not In Work Force | 816 | 6,598 | 12,963 | |
Workforce Employed | 1,429 | 9,765 | 19,177 | |
Workforce Unemployed | 97 | 369 | 880 | |
Civlian Workforce | 1,526 | 10,134 | 20,057 | |
Military Workforce | 0 | 6 | 19 | |
Total Households | 1,253 | 8,484 | 16,774 | |
Family Households | 776 | 5,542 | 10,950 | |
Non-Family Households | 477 | 2,942 | 5,824 | |
Married Couple | 598 | 4,802 | 9,589 | |
Other Family | 177 | 739 | 1,360 | |
Married w/Child | 234 | 1,022 | 2,244 | |
Single Male w/Child | 1 | 53 | 108 | |
Single Female w/Child | 114 | 355 | 540 |
Population Change Last Two Decades - Plus Projection
2000 | % | 2010 | % | 2020 | % | 2030 | |
---|---|---|---|---|---|---|---|
Connecticut | 3,405,565 | +5 | 3,574,097 | +1 | 3,604,603 | +1 | 3,633,994 |
Middlesex County | 155,071 | +7 | 165,676 | +1 | 167,213 | 0 | 166,533 |
New London County | 259,088 | +6 | 274,055 | +2 | 278,756 | +1 | 280,847 |
New York | 18,976,457 | +2 | 19,378,102 | +4 | 20,146,131 | +2 | 20,604,030 |
Suffolk County | 1,419,369 | +5 | 1,493,350 | 0 | 1,497,391 | -1 | 1,488,885 |
Total Working Age Population:
Total Households:
Total Working Age Population:
Total Households:
Total Working Age Population:
Total Households: