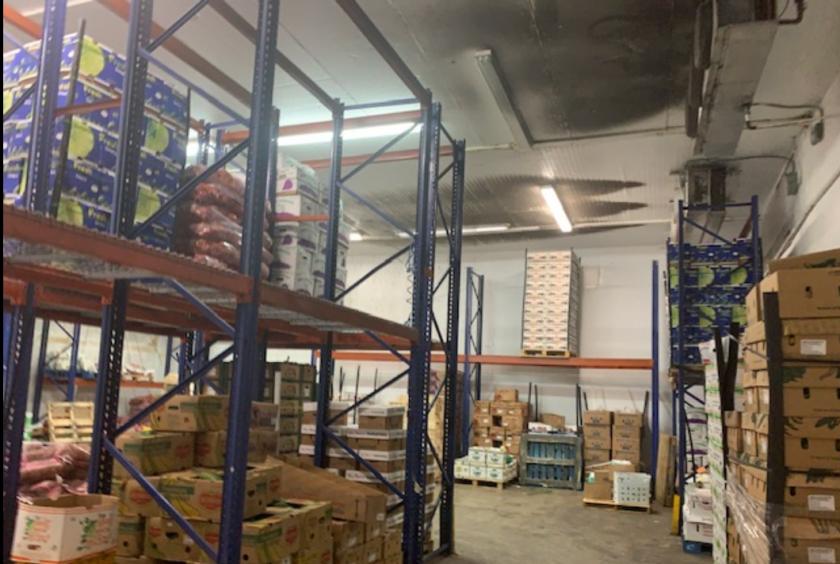
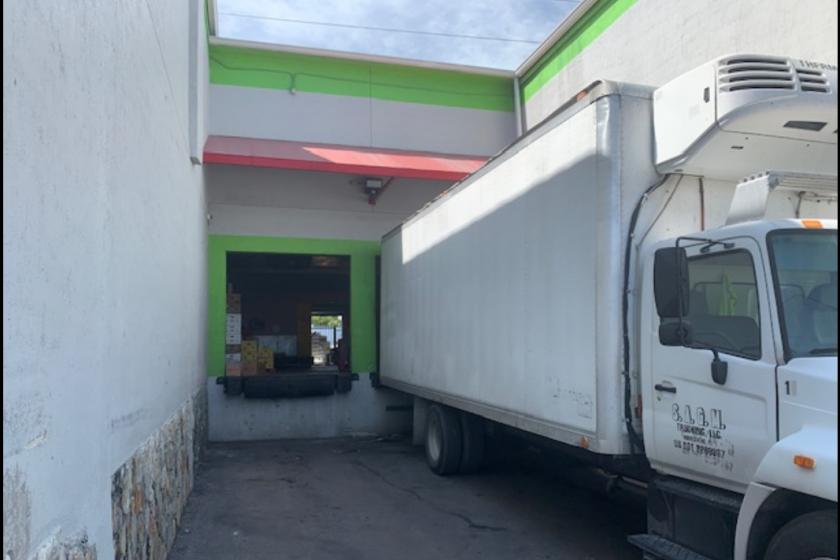
Allapattah Urban core industrial building 9,200 sf with 8,000 SF Are walking Cooler and 11,800 SF of land , 22 ft ceiling. This site sits in the heart of Allapattah , great accessibility to mayor freeways, to Wynwood, 10 min to Brickell, Downtown, airport, seaport, Gables and more. The property provide great utility for produce service and all sorts of Industrial uses, as well as great development value as a major players who already own in the area continue their forward march to mayor development and transformation.
All information based on the most recently available data (updated annually) and is provided in 1-mile, 3-mile, and 5-mile radii (radiuses) of the property location.
1-Mile | 3-Miles | 5-Miles | ||
---|---|---|---|---|
Total Population | 42,480 | 344,941 | 783,316 | |
Population Median Age | 39 | 39 | 41 | |
Population by Age | 0-9 Yrs | 5165 (12%) | 37315 (10%) | 86558 (11%) |
10-19 Yrs | 4394 (10%) | 32490 (9%) | 66743 (8%) | |
20-29 Yrs | 5838 (13%) | 51831 (15%) | 98664 (12%) | |
30-39 Yrs | 7108 (16%) | 62188 (18%) | 138741 (17%) | |
40-49 Yrs | 5159 (12%) | 47866 (13%) | 116776 (14%) | |
50-59 Yrs | 5201 (12%) | 44310 (12%) | 105618 (13%) | |
60-69 Yrs | 4828 (11%) | 32798 (9%) | 79495 (10%) | |
70+ Yrs | 4786 (11%) | 36143 (10%) | 90721 (11%) | |
Median HH Income | $26,302 | $36,459 | $49,516 | |
Total Household Income | < 24K | 6945 (48%) | 50041 (37%) | 94027 (29%) |
25-49K | 3958 (27%) | 31782 (23%) | 65388 (20%) | |
50-74K | 2013 (13%) | 19458 (14%) | 46187 (14%) | |
75-99K | 856 (5%) | 12615 (9%) | 32410 (10%) | |
100-199K | 527 (3%) | 14246 (10%) | 47994 (15%) | |
200K+ | 113 (0%) | 5975 (4%) | 30941 (9%) | |
Highest Education Level | No Diploma | 10443 | 62822 | 108191 |
Diploma or GED | 9964 | 72851 | 142546 | |
Some College | 3808 | 32618 | 74163 | |
Assoc. Degree | 1860 | 16951 | 42738 | |
Bachelors Degree | 2936 | 41740 | 124461 | |
Higher Degree | 1142 | 27293 | 100111 | |
Total Housing Units | 15,519 | 158,282 | 388,853 | |
--Owner-Occupied | 2,553 | 32,763 | 110,425 | |
--Renter-Occupied | 11,859 | 101,354 | 206,521 | |
Owner-Occupied Values | < 100K | 361 | 3586 | 9031 |
100-199K | 744 | 6551 | 14641 | |
200-299K | 812 | 8286 | 24283 | |
300-399K | 317 | 5012 | 15527 | |
400-499K | 109 | 3183 | 10858 | |
500K+ | 212 | 6146 | 36085 | |
Total Working Age Population | 34,850 | 287,779 | 653,776 | |
In Work Force | 18,481 | 179,163 | 420,759 | |
Not In Work Force | 16,369 | 108,616 | 233,017 | |
Workforce Employed | 17,495 | 167,624 | 396,974 | |
Workforce Unemployed | 969 | 11,435 | 23,386 | |
Civlian Workforce | 18,464 | 179,059 | 420,360 | |
Military Workforce | 17 | 104 | 399 | |
Total Households | 14,412 | 134,117 | 316,946 | |
Family Households | 8,495 | 71,255 | 168,907 | |
Non-Family Households | 5,917 | 62,861 | 148,039 | |
Married Couple | 4,608 | 39,496 | 105,650 | |
Other Family | 3,887 | 31,760 | 63,258 | |
Married w/Child | 1,866 | 14,568 | 38,535 | |
Single Male w/Child | 310 | 2,727 | 5,731 | |
Single Female w/Child | 1,576 | 10,608 | 20,775 |
Population Change Last Two Decades - Plus Projection
2000 | % | 2010 | % | 2020 | % | 2030 | |
---|---|---|---|---|---|---|---|
Florida | 15,982,378 | +18 | 18,801,310 | +14 | 21,517,610 | +13 | 24,340,457 |
Miami-Dade County | 2,253,362 | +11 | 2,496,435 | +15 | 2,861,579 | +11 | 3,190,242 |
Monroe County | 79,589 | -8 | 73,090 | +1 | 74,004 | 0 | 74,301 |
No part of this information may be copied, reproduced, repurposed, or screen-captured for any commercial purpose without prior written authorization from MyEListing.
While we strive to provide the most accurate information, all listing information, and demographic data, is provided by third-parties. As such, MyEListing will not be responsible for the accuracy of the information. It is strongly recommended that you verify all information with the listing agent, and any relevant agencies, prior to making any decisions.