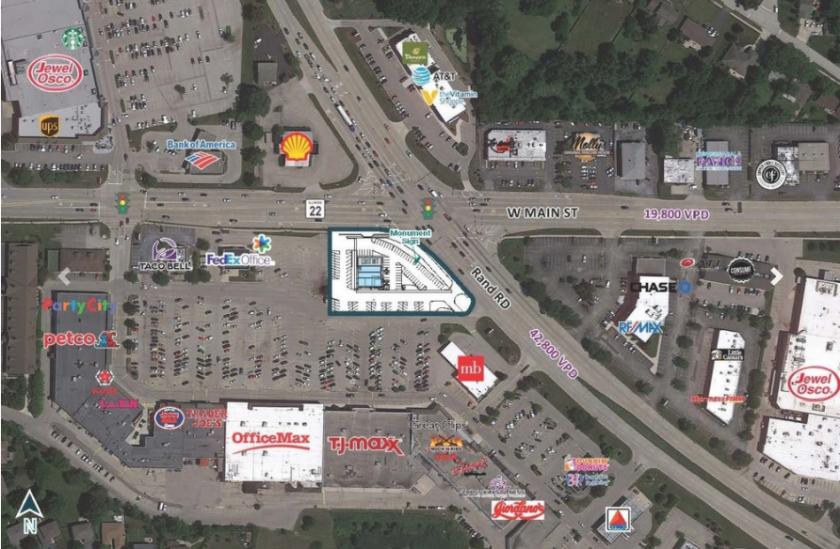
1-Mile | 3-Miles | 5-Miles | ||
---|---|---|---|---|
Total Population | 6,577 | 41,003 | 90,616 | |
Population Median Age | 38 | 40 | 40 | |
Population by Age | 0-9 Yrs | 680 (10%) | 4499 (10%) | 10684 (11%) |
10-19 Yrs | 1194 (18%) | 6513 (15%) | 13305 (14%) | |
20-29 Yrs | 637 (9%) | 3764 (9%) | 8053 (8%) | |
30-39 Yrs | 707 (10%) | 4585 (11%) | 10155 (11%) | |
40-49 Yrs | 983 (14%) | 5373 (13%) | 11764 (12%) | |
50-59 Yrs | 1253 (19%) | 7447 (18%) | 16670 (18%) | |
60-69 Yrs | 544 (8%) | 4810 (11%) | 10804 (11%) | |
70+ Yrs | 579 (8%) | 4011 (9%) | 9182 (10%) | |
Median HH Income | $118,035 | $130,072 | $122,150 | |
Total Household Income | < 24K | 138 (6%) | 1026 (7%) | 2796 (8%) |
25-49K | 236 (10%) | 1414 (9%) | 4041 (12%) | |
50-74K | 262 (11%) | 1434 (9%) | 3651 (11%) | |
75-99K | 257 (11%) | 1298 (9%) | 3026 (9%) | |
100-199K | 789 (35%) | 5195 (36%) | 10630 (32%) | |
200K+ | 538 (24%) | 3998 (27%) | 8884 (26%) | |
Highest Education Level | No Diploma | 265 | 1098 | 2822 |
Diploma or GED | 848 | 3707 | 8408 | |
Some College | 802 | 4200 | 9444 | |
Assoc. Degree | 380 | 1791 | 4090 | |
Bachelors Degree | 1408 | 10053 | 22148 | |
Higher Degree | 808 | 6984 | 15493 | |
Total Housing Units | 2,306 | 15,257 | 35,219 | |
--Owner-Occupied | 1,782 | 12,381 | 27,354 | |
--Renter-Occupied | 437 | 1,984 | 5,676 | |
Owner-Occupied Values | < 100K | 146 | 309 | 771 |
100-199K | 198 | 798 | 2275 | |
200-299K | 279 | 1971 | 3836 | |
300-399K | 403 | 2778 | 5151 | |
400-499K | 339 | 2430 | 4551 | |
500K+ | 418 | 4095 | 10770 | |
Total Working Age Population | 5,184 | 32,636 | 71,777 | |
In Work Force | 3,562 | 22,131 | 47,998 | |
Not In Work Force | 1,623 | 10,505 | 23,779 | |
Workforce Employed | 3,472 | 21,440 | 46,492 | |
Workforce Unemployed | 90 | 691 | 1,505 | |
Civlian Workforce | 3,562 | 22,131 | 47,998 | |
Military Workforce | 0 | 0 | 1 | |
Total Households | 2,219 | 14,365 | 33,030 | |
Family Households | 1,773 | 11,544 | 25,423 | |
Non-Family Households | 446 | 2,821 | 7,607 | |
Married Couple | 1,263 | 9,915 | 21,523 | |
Other Family | 510 | 1,628 | 3,900 | |
Married w/Child | 663 | 4,342 | 9,259 | |
Single Male w/Child | 77 | 250 | 640 | |
Single Female w/Child | 111 | 523 | 1,462 |
Population Change Last Two Decades - Plus Projection
2000 | % | 2010 | % | 2020 | % | 2030 | |
---|---|---|---|---|---|---|---|
Illinois | 12,419,293 | +3 | 12,830,632 | +12 | 14,316,487 | +6 | 15,138,849 |
Cook County | 5,376,741 | -3 | 5,194,675 | +10 | 5,707,832 | +5 | 5,990,243 |
Lake County | 644,356 | +9 | 703,462 | +17 | 820,250 | +6 | 873,024 |
McHenry County | 260,077 | +19 | 308,760 | +32 | 407,931 | +9 | 443,398 |
Total Working Age Population:
Total Households:
Total Working Age Population:
Total Households:
Total Working Age Population:
Total Households: