Industrial Properties
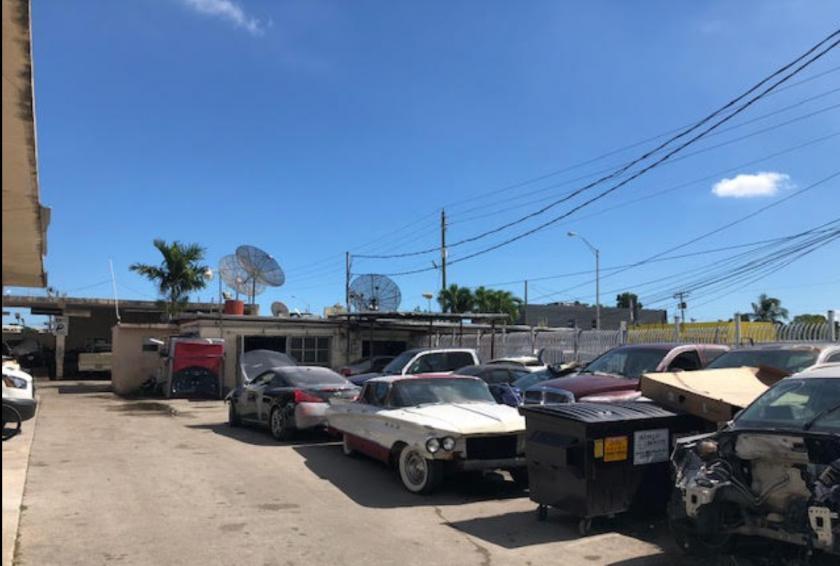
2395 Northwest 36th Street Miami, FL 33142
2395 Northwest 36th Street Miami, FL 33142

Details & Description
Listing Agents

Markos Bertolotti
M: 305-632-2057
MB@faustocommercial.com
M: 305-632-2057
MB@faustocommercial.com
While we strive to provide the most accurate information, all listing information, and demographic data, is provided by third-parties. As such, MyEListing will not be responsible for the accuracy of the information. It is strongly recommended that you verify all information with the listing agent, and any relevant agencies, prior to making any decisions.