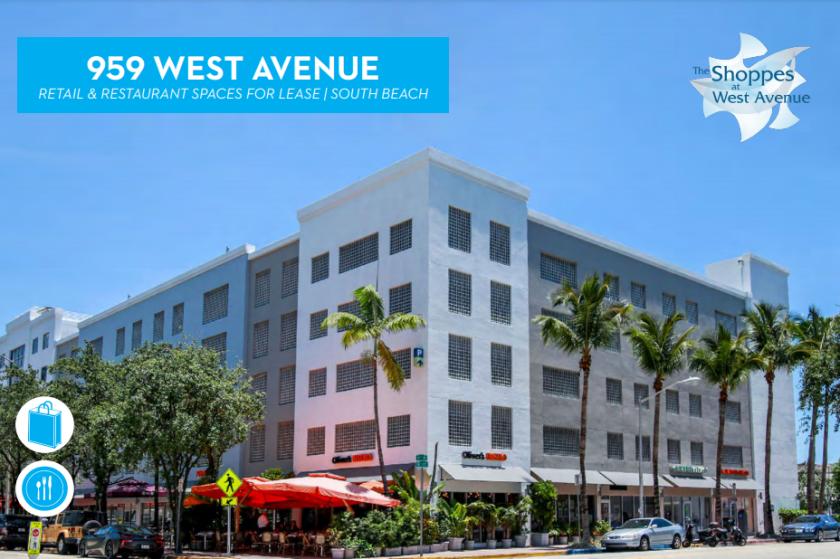
As exclusive agents, we are pleased to offer these prime retail/restaurant spaces at The Shoppes at West Avenue in Miami Beach.
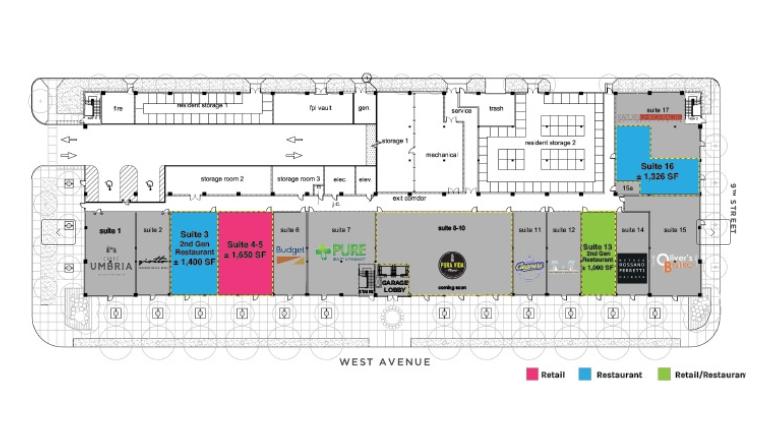
Suite #3 is a ± 1,400 SF Second Generation restaurant with grease trap & hood in place
Suite #4-5 is seeking retail/space users
Suite #13 is a Second Generation restaurant equipped with a grease trap
All Suites are seeking activated storefront uses
Located on the local side of Miami Beach, near Whole Foods and one block from the Mondrian Hotel
Tremendous block front exposure
Thousands of residential units within walking distance
Second Generation restaurants with ample outdoor seating
Public parking garage on site with over 700 parking spaces
NEIGHBORING TENANTS INCLUDE:
Budget Car Rental, Burgerim (Coming Soon), Coco Bambu, David's Cafe, European Wax Center, Gogo's, Macchialina, Metropcs, OXXO Cleaners, Reebok Crossfit, Rossano Ferretti, Walgreens, Whole Foods
No part of this information may be copied, reproduced, repurposed, or screen-captured for any commercial purpose without prior written authorization from MyEListing.
While we strive to provide the most accurate information, all listing information, and demographic data, is provided by third-parties. As such, MyEListing will not be responsible for the accuracy of the information. It is strongly recommended that you verify all information with the listing agent, and any relevant agencies, prior to making any decisions.
What is the building size of this commercial Retail property?
The size of this lease property at '.959 West Avenue.' is 1650 square feet
What kind of Retail is the propery at 959 West Avenue?
The property at 959 West Avenue Miami Beach, FL 33139 is listed as a Food Service Retail property
What is the population within 1 mile of 959 West Avenue in Miami Beach?
The population within 1 mile of 959 West Avenue Miami Beach, FL 33139 is 40,467 people.
Who do I contact for questions about 959 West Avenue?
You should contact the listing agent,
Andrew Rosenberg, for any details regarding this commercial listing.