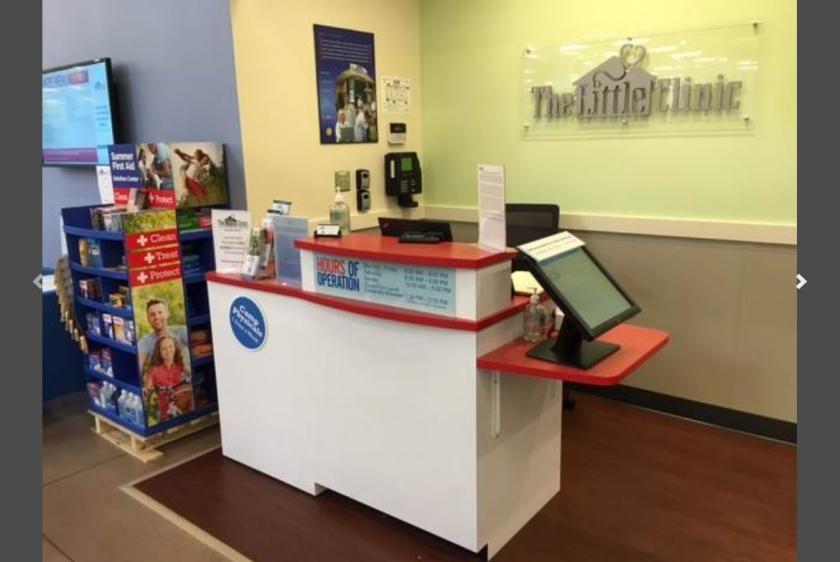
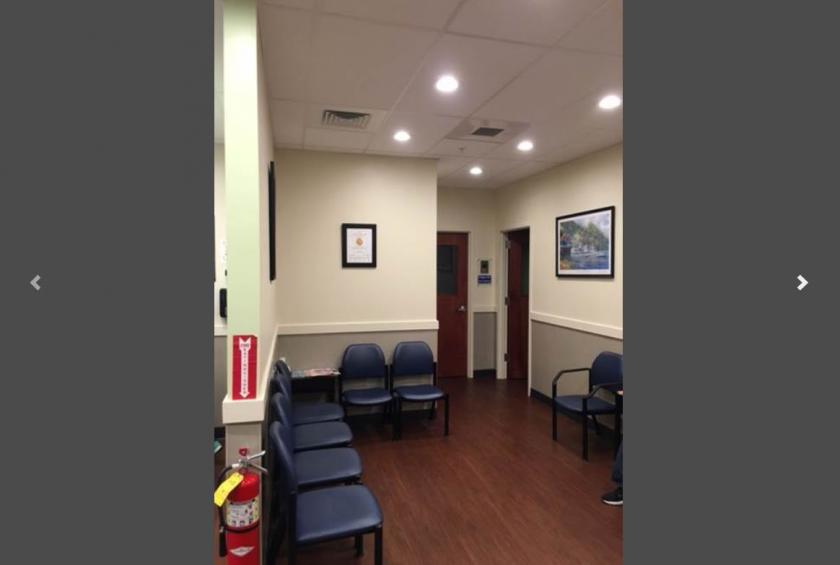
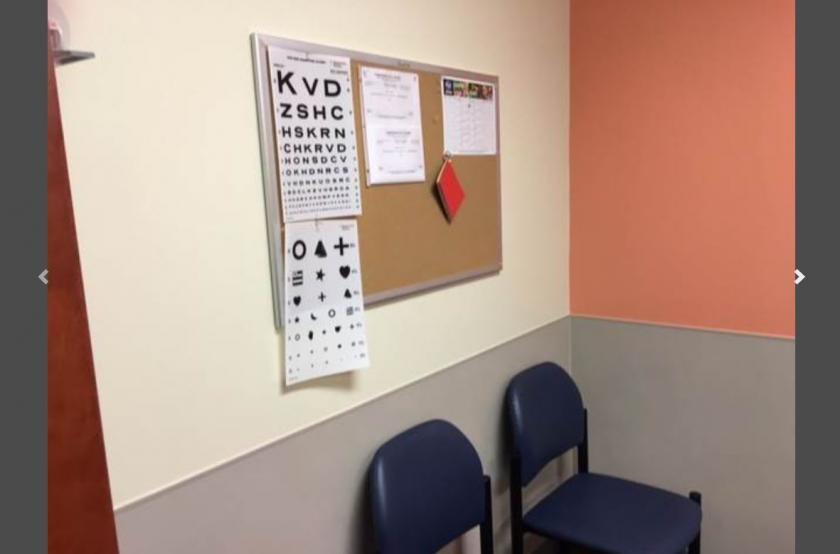
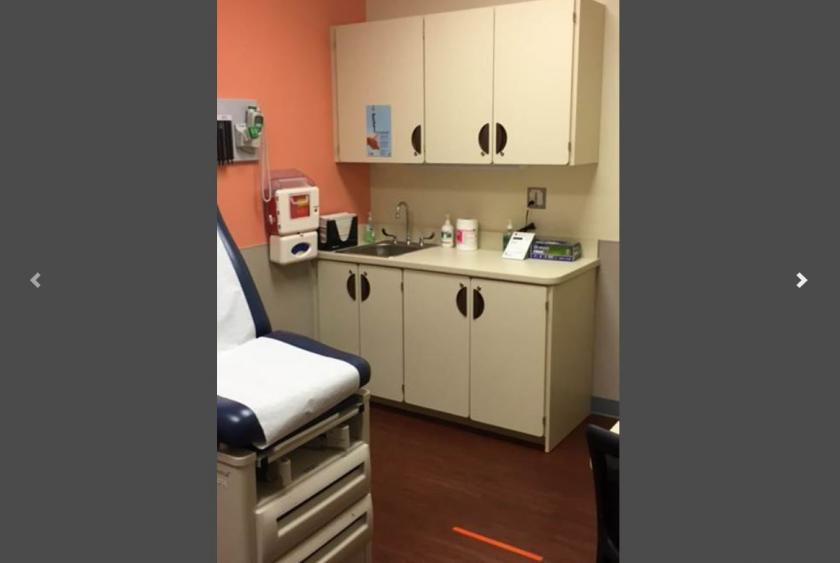
1-Mile | 3-Miles | 5-Miles | ||
---|---|---|---|---|
Total Population | 13,115 | 90,697 | 249,442 | |
Population Median Age | 36 | 38 | 36 | |
Population by Age | 0-9 Yrs | 2681 (20%) | 12002 (13%) | 32389 (12%) |
10-19 Yrs | 1559 (11%) | 9732 (10%) | 32247 (12%) | |
20-29 Yrs | 1734 (13%) | 15584 (17%) | 48438 (19%) | |
30-39 Yrs | 1532 (11%) | 13013 (14%) | 34324 (13%) | |
40-49 Yrs | 1407 (10%) | 9714 (10%) | 25589 (10%) | |
50-59 Yrs | 1509 (11%) | 11563 (12%) | 29434 (11%) | |
60-69 Yrs | 1432 (10%) | 10360 (11%) | 25719 (10%) | |
70+ Yrs | 1260 (9%) | 8730 (9%) | 21302 (8%) | |
Median HH Income | $30,891 | $51,340 | $53,406 | |
Total Household Income | < 24K | 2273 (44%) | 8842 (24%) | 22471 (24%) |
25-49K | 1325 (25%) | 8950 (24%) | 21162 (22%) | |
50-74K | 855 (16%) | 7442 (20%) | 17585 (18%) | |
75-99K | 425 (8%) | 4666 (12%) | 11718 (12%) | |
100-199K | 237 (4%) | 5415 (14%) | 15877 (17%) | |
200K+ | 41 (0%) | 1197 (3%) | 3904 (4%) | |
Highest Education Level | No Diploma | 1825 | 7722 | 18831 |
Diploma or GED | 2500 | 17446 | 42549 | |
Some College | 2220 | 16377 | 40670 | |
Assoc. Degree | 846 | 5350 | 13043 | |
Bachelors Degree | 551 | 9180 | 26457 | |
Higher Degree | 307 | 5609 | 17415 | |
Total Housing Units | 5,887 | 41,511 | 103,751 | |
--Owner-Occupied | 1,978 | 18,555 | 48,340 | |
--Renter-Occupied | 3,179 | 17,957 | 44,377 | |
Owner-Occupied Values | < 100K | 336 | 2212 | 4532 |
100-199K | 1404 | 9631 | 19657 | |
200-299K | 164 | 4632 | 15117 | |
300-399K | 38 | 838 | 4184 | |
400-499K | 19 | 457 | 2252 | |
500K+ | 18 | 786 | 2599 | |
Total Working Age Population | 9,323 | 72,613 | 199,605 | |
In Work Force | 5,438 | 47,108 | 127,813 | |
Not In Work Force | 3,885 | 25,505 | 71,792 | |
Workforce Employed | 4,839 | 39,319 | 109,652 | |
Workforce Unemployed | 486 | 3,585 | 9,209 | |
Civlian Workforce | 5,325 | 42,905 | 118,861 | |
Military Workforce | 113 | 4,203 | 8,952 | |
Total Households | 5,158 | 36,513 | 92,717 | |
Family Households | 2,937 | 19,821 | 55,244 | |
Non-Family Households | 2,220 | 16,692 | 37,473 | |
Married Couple | 973 | 11,616 | 32,965 | |
Other Family | 1,964 | 8,205 | 22,279 | |
Married w/Child | 295 | 4,111 | 12,084 | |
Single Male w/Child | 106 | 995 | 2,222 | |
Single Female w/Child | 1,070 | 3,329 | 10,075 |
Population Change Last Two Decades - Plus Projection
2000 | % | 2010 | % | 2020 | % | 2030 | |
---|---|---|---|---|---|---|---|
Virginia | 7,078,515 | +13 | 8,001,024 | +8 | 8,655,021 | +8 | 9,331,666 |
Chesapeake city | 199,184 | +12 | 222,209 | +12 | 249,244 | +9 | 270,506 |
Norfolk city | 234,403 | +4 | 242,803 | +2 | 246,881 | +1 | 249,889 |
Portsmouth city | 100,565 | -5 | 95,535 | -1 | 95,027 | -5 | 90,715 |
Suffolk city | 63,677 | +33 | 84,585 | +12 | 94,733 | +16 | 109,424 |
Total Working Age Population:
Total Households:
Total Working Age Population:
Total Households:
Total Working Age Population:
Total Households: