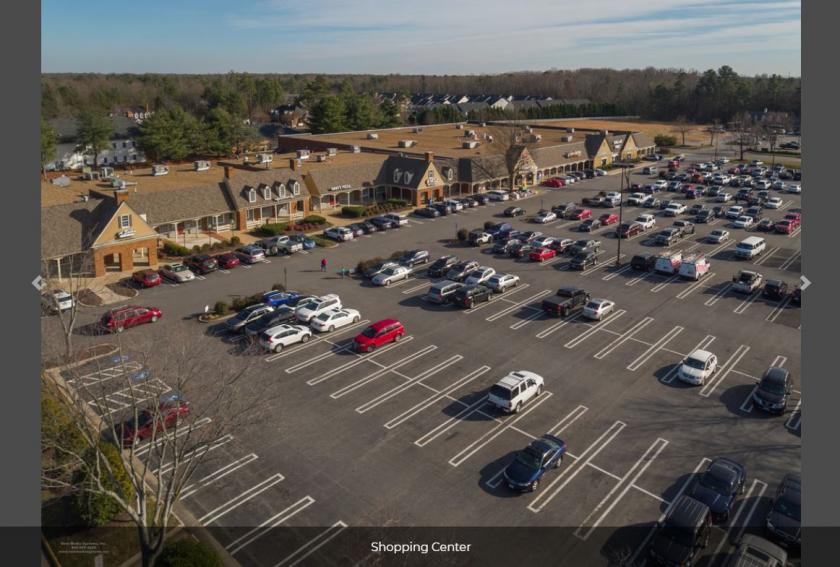
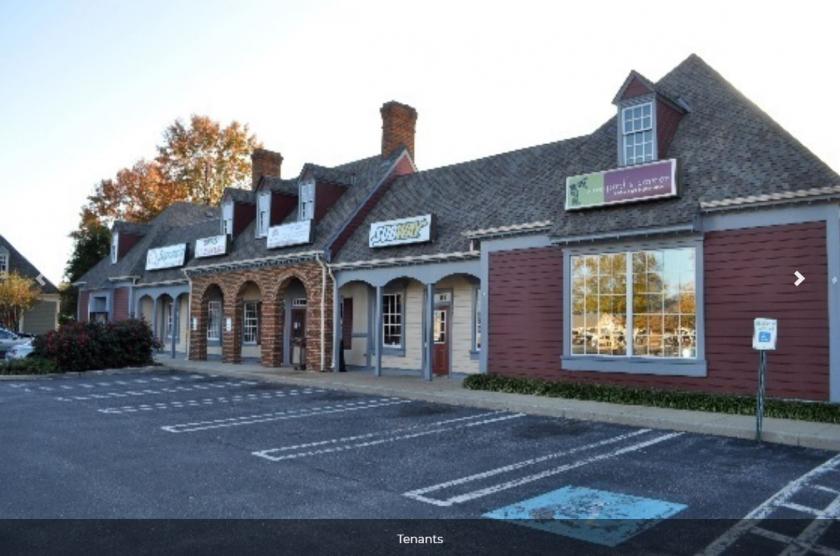
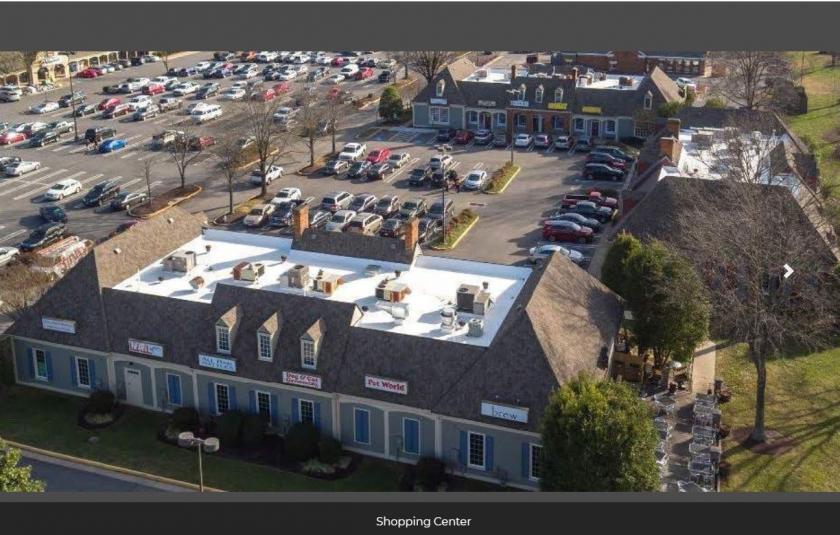
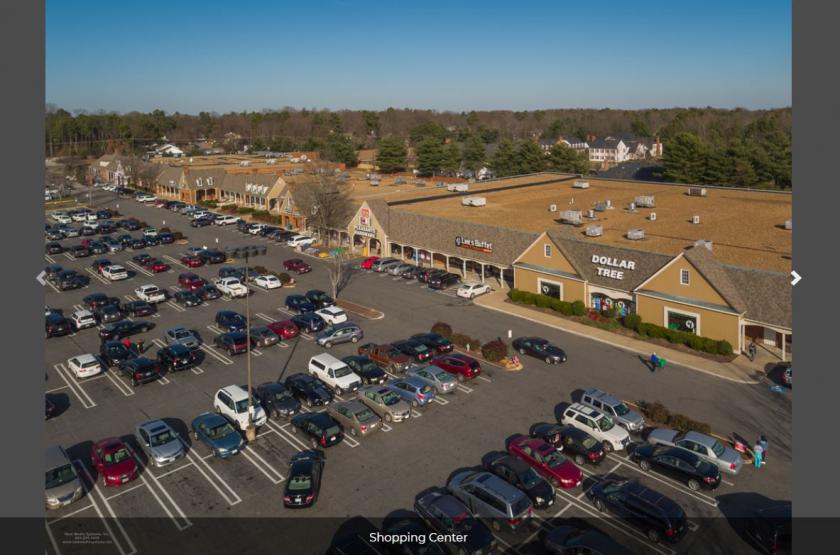
1-Mile | 3-Miles | 5-Miles | ||
---|---|---|---|---|
Total Population | 5,261 | 31,646 | 81,677 | |
Population Median Age | 38 | 39 | 39 | |
Population by Age | 0-9 Yrs | 662 (12%) | 3819 (12%) | 10005 (12%) |
10-19 Yrs | 710 (13%) | 3892 (12%) | 10052 (12%) | |
20-29 Yrs | 821 (15%) | 4464 (14%) | 11023 (13%) | |
30-39 Yrs | 720 (13%) | 3901 (12%) | 10443 (12%) | |
40-49 Yrs | 642 (12%) | 4031 (12%) | 11082 (13%) | |
50-59 Yrs | 540 (10%) | 4476 (14%) | 11926 (14%) | |
60-69 Yrs | 549 (10%) | 4072 (12%) | 9841 (12%) | |
70+ Yrs | 618 (11%) | 2990 (9%) | 7305 (8%) | |
Median HH Income | $58,879 | $76,159 | $74,026 | |
Total Household Income | < 24K | 287 (15%) | 1164 (10%) | 3209 (10%) |
25-49K | 407 (22%) | 2305 (20%) | 5926 (20%) | |
50-74K | 361 (19%) | 2189 (19%) | 5747 (19%) | |
75-99K | 361 (19%) | 1879 (16%) | 4793 (16%) | |
100-199K | 404 (21%) | 3452 (30%) | 8502 (28%) | |
200K+ | 27 (1%) | 501 (4%) | 1205 (4%) | |
Highest Education Level | No Diploma | 434 | 1867 | 5491 |
Diploma or GED | 1141 | 6511 | 16867 | |
Some College | 857 | 4692 | 11721 | |
Assoc. Degree | 339 | 2247 | 5396 | |
Bachelors Degree | 515 | 4216 | 10293 | |
Higher Degree | 302 | 2268 | 6068 | |
Total Housing Units | 1,886 | 11,874 | 30,665 | |
--Owner-Occupied | 1,018 | 8,220 | 21,626 | |
--Renter-Occupied | 828 | 3,270 | 7,758 | |
Owner-Occupied Values | < 100K | 20 | 267 | 819 |
100-199K | 558 | 3784 | 9066 | |
200-299K | 338 | 2519 | 7618 | |
300-399K | 76 | 891 | 2511 | |
400-499K | 12 | 491 | 915 | |
500K+ | 14 | 267 | 696 | |
Total Working Age Population | 4,181 | 25,804 | 66,121 | |
In Work Force | 2,538 | 16,735 | 44,020 | |
Not In Work Force | 1,644 | 9,069 | 22,101 | |
Workforce Employed | 2,322 | 15,695 | 41,311 | |
Workforce Unemployed | 205 | 952 | 2,404 | |
Civlian Workforce | 2,527 | 16,647 | 43,715 | |
Military Workforce | 11 | 88 | 304 | |
Total Households | 1,846 | 11,490 | 29,384 | |
Family Households | 1,256 | 8,191 | 21,084 | |
Non-Family Households | 591 | 3,299 | 8,300 | |
Married Couple | 806 | 6,036 | 15,357 | |
Other Family | 450 | 2,154 | 5,727 | |
Married w/Child | 319 | 2,196 | 5,820 | |
Single Male w/Child | 12 | 308 | 664 | |
Single Female w/Child | 250 | 903 | 2,105 |
Population Change Last Two Decades - Plus Projection
2000 | % | 2010 | % | 2020 | % | 2030 | |
---|---|---|---|---|---|---|---|
Virginia | 7,078,515 | +13 | 8,001,024 | +8 | 8,655,021 | +8 | 9,331,666 |
Chesterfield County | 259,903 | +22 | 316,236 | +12 | 353,841 | +12 | 396,647 |
Henrico County | 262,300 | +17 | 306,935 | +8 | 332,103 | +9 | 363,259 |
Total Working Age Population:
Total Households:
Total Working Age Population:
Total Households:
Total Working Age Population:
Total Households: