Description
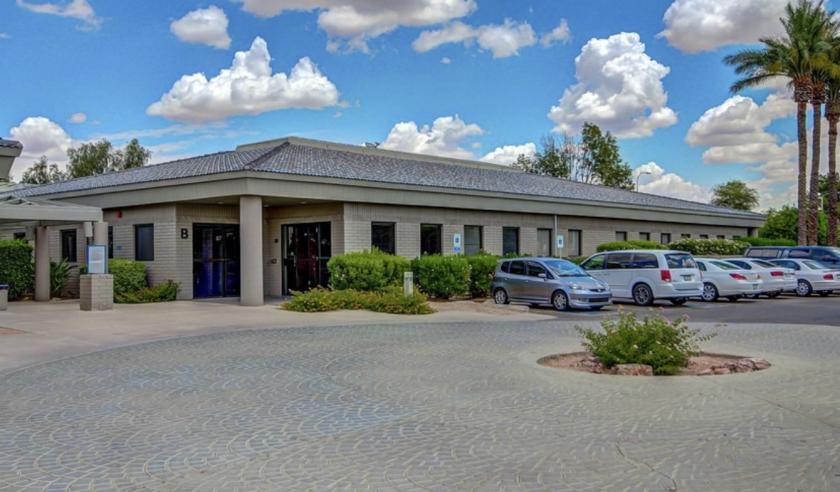
Warner Medical Park is a high-quality, in-fill medical office condominium project built
in 1987 located in Chandler, Arizona. Warner Medical Park consists of five buildings
that is home to a diverse tenant roster that benefits from the attractive neighboring
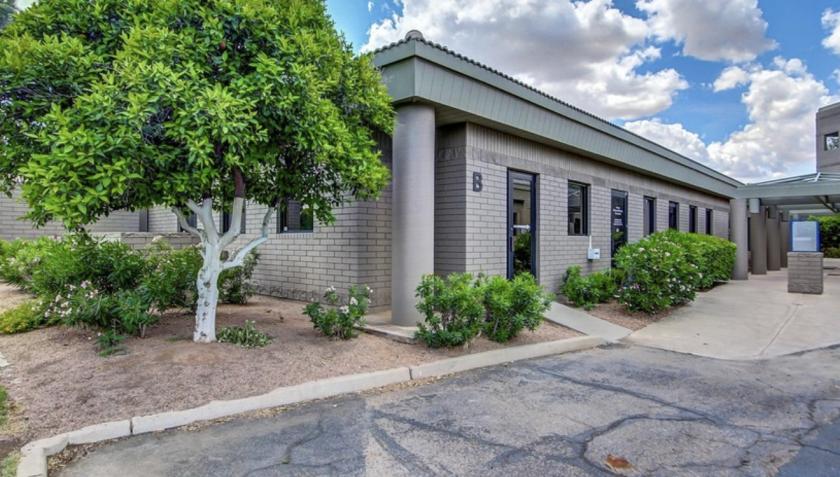
demographics, with well-kept common areas and ample parking. Building B is ideally
located at the main entrance of the community, featuring a convenient circle drive for
patient drop off and pick up. This property offers the following benefits:
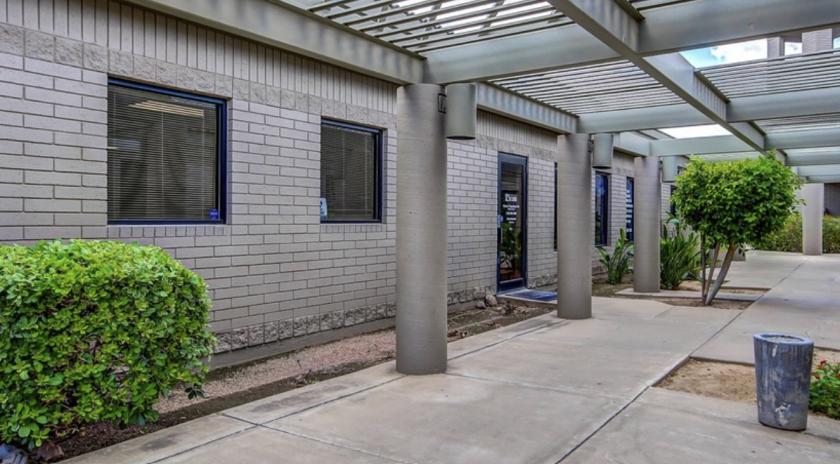
• Building is in excellent condition - no deferred maintenance
• Excellent surrounding demographics
• Strategically located in between Banner Desert Medical Center, Cardon Children’s
Medical Center & Dignity Health Chandler & Gilbert Regional Medical Centers
Highlights
Available for Lease
Lease: $18.00 PSF MG (Tenant pays Janitorial)
Total Building: +/-10,255 SF
Suite B-2: +/- 1,083 SF
Strategically located in between Banner Desert Medical Center, Cardon Children’s Medical Center & Dignity Health Chandler & Gilbert Regional Medical Centers
Excellent surrounding demographics
No part of this information may be copied, reproduced, repurposed, or screen-captured for any commercial purpose without prior written authorization from MyEListing.
While we strive to provide the most accurate information, all listing information, and demographic data, is provided by third-parties. As such, MyEListing will not be responsible for the accuracy of the information. It is strongly recommended that you verify all information with the listing agent, and any relevant agencies, prior to making any decisions.
What is the asking price for 604 West Warner Road in Gilbert?
The asking price for 604 West Warner Road is $18.00 a SF per Year
What is the building size of this commercial Office property?
The size of this lease property at '.604 West Warner Road.' is 1083 square feet
What kind of Office is the propery at 604 West Warner Road?
The property at 604 West Warner Road Gilbert, AZ 85233 is listed as a Medical Office property
What is the population within 1 mile of 604 West Warner Road in Gilbert?
The population within 1 mile of 604 West Warner Road Gilbert, AZ 85233 is 15,618 people.
Who do I contact for questions about 604 West Warner Road?
You should contact the listing agent,
Steve Berghoff, for any details regarding this commercial listing.