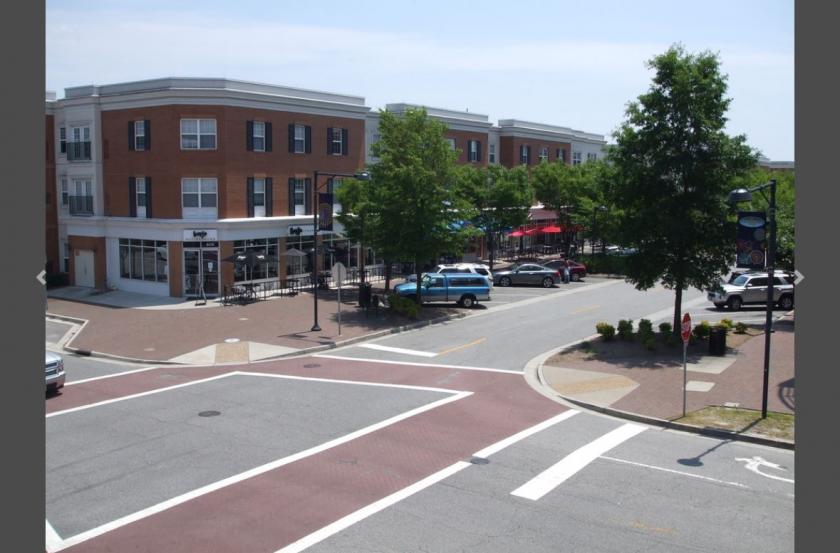
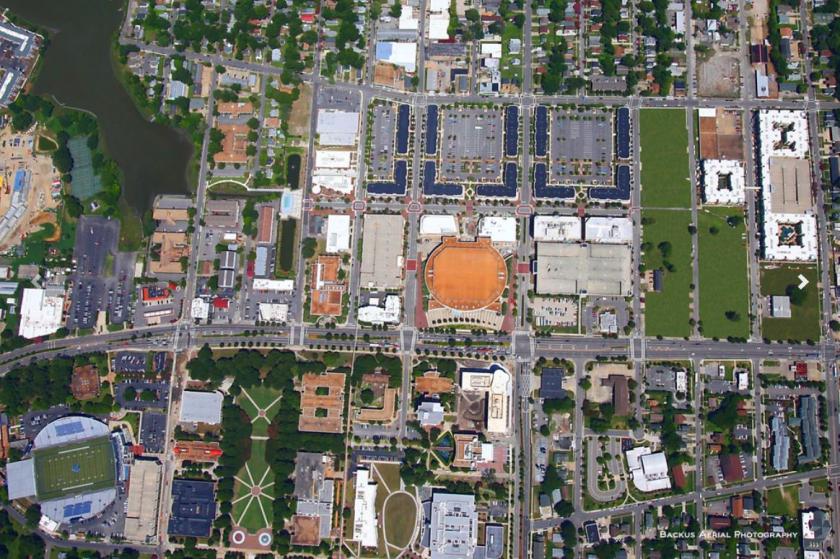
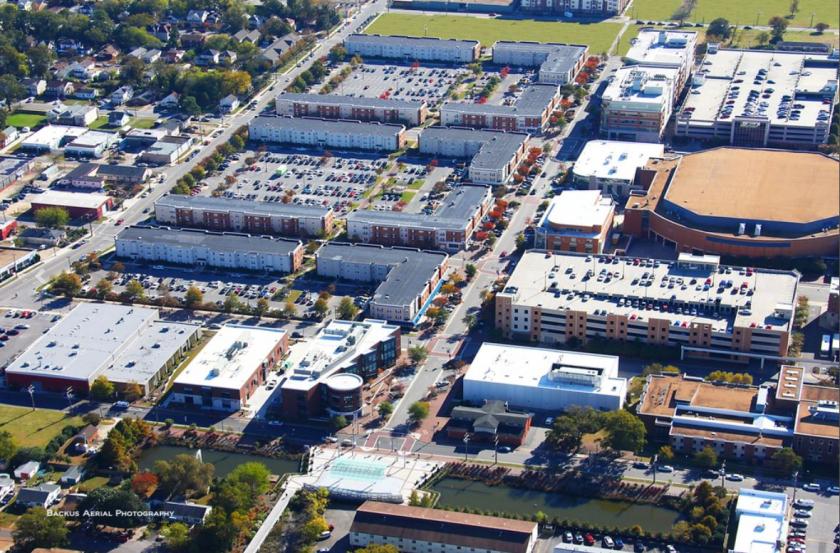
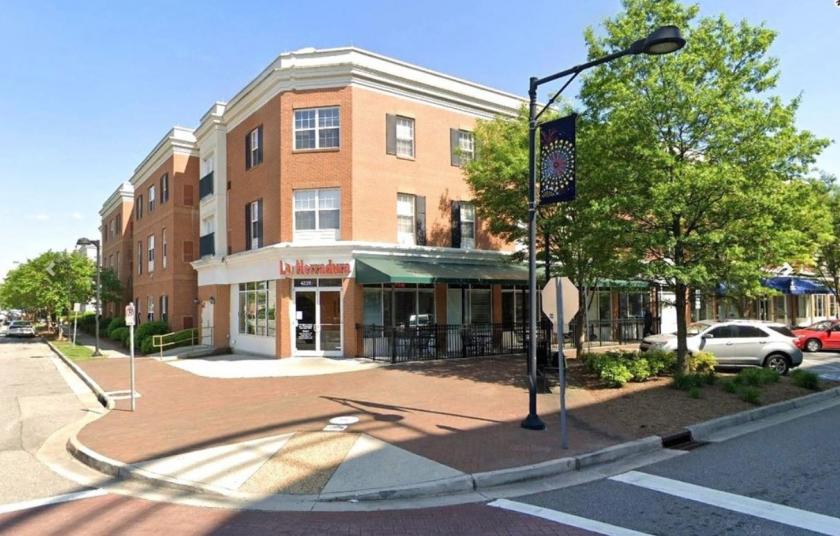
1-Mile | 3-Miles | 5-Miles | ||
---|---|---|---|---|
Total Population | 25,830 | 130,322 | 295,173 | |
Population Median Age | 31 | 35 | 35 | |
Population by Age | 0-9 Yrs | 2047 (7%) | 14643 (11%) | 36389 (12%) |
10-19 Yrs | 4783 (18%) | 15394 (11%) | 35772 (12%) | |
20-29 Yrs | 9071 (35%) | 34385 (26%) | 72547 (24%) | |
30-39 Yrs | 3150 (12%) | 18437 (14%) | 41839 (14%) | |
40-49 Yrs | 1828 (7%) | 12301 (9%) | 29070 (9%) | |
50-59 Yrs | 1983 (7%) | 13744 (10%) | 31456 (10%) | |
60-69 Yrs | 1829 (7%) | 11832 (9%) | 27221 (9%) | |
70+ Yrs | 1139 (4%) | 9584 (7%) | 20879 (7%) | |
Median HH Income | $51,942 | $56,453 | $52,365 | |
Total Household Income | < 24K | 2319 (28%) | 11762 (24%) | 25794 (24%) |
25-49K | 1580 (19%) | 10118 (20%) | 24491 (23%) | |
50-74K | 1232 (15%) | 7983 (16%) | 20032 (19%) | |
75-99K | 956 (11%) | 5886 (12%) | 12808 (12%) | |
100-199K | 1429 (17%) | 8967 (18%) | 17154 (16%) | |
200K+ | 489 (6%) | 3607 (7%) | 4804 (4%) | |
Highest Education Level | No Diploma | 951 | 7877 | 21337 |
Diploma or GED | 2406 | 15935 | 45008 | |
Some College | 2391 | 17793 | 45785 | |
Assoc. Degree | 756 | 5642 | 14947 | |
Bachelors Degree | 3079 | 18175 | 32146 | |
Higher Degree | 2760 | 14846 | 22275 | |
Total Housing Units | 9,159 | 54,202 | 117,063 | |
--Owner-Occupied | 3,051 | 20,976 | 47,733 | |
--Renter-Occupied | 4,954 | 27,348 | 57,350 | |
Owner-Occupied Values | < 100K | 168 | 1376 | 3778 |
100-199K | 642 | 5863 | 19103 | |
200-299K | 877 | 5454 | 14040 | |
300-399K | 583 | 3149 | 4465 | |
400-499K | 490 | 1898 | 2431 | |
500K+ | 291 | 3238 | 3917 | |
Total Working Age Population | 22,843 | 108,791 | 240,480 | |
In Work Force | 14,385 | 73,506 | 166,016 | |
Not In Work Force | 8,459 | 35,285 | 74,464 | |
Workforce Employed | 12,450 | 56,767 | 122,521 | |
Workforce Unemployed | 1,218 | 4,937 | 10,540 | |
Civlian Workforce | 13,668 | 61,704 | 133,061 | |
Military Workforce | 717 | 11,802 | 32,955 | |
Total Households | 8,005 | 48,324 | 105,083 | |
Family Households | 3,625 | 25,911 | 61,016 | |
Non-Family Households | 4,380 | 22,413 | 44,067 | |
Married Couple | 2,619 | 16,844 | 37,072 | |
Other Family | 1,006 | 9,067 | 23,944 | |
Married w/Child | 1,112 | 6,573 | 14,732 | |
Single Male w/Child | 111 | 961 | 2,271 | |
Single Female w/Child | 456 | 4,344 | 11,272 |
Population Change Last Two Decades - Plus Projection
2000 | % | 2010 | % | 2020 | % | 2030 | |
---|---|---|---|---|---|---|---|
Virginia | 7,078,515 | +13 | 8,001,024 | +8 | 8,655,021 | +8 | 9,331,666 |
Chesapeake city | 199,184 | +12 | 222,209 | +12 | 249,244 | +9 | 270,506 |
Hampton city | 146,437 | -6 | 137,436 | -1 | 135,530 | -6 | 127,842 |
Newport News city | 180,150 | 0 | 180,719 | 0 | 181,581 | -1 | 179,752 |
Norfolk city | 234,403 | +4 | 242,803 | +2 | 246,881 | +1 | 249,889 |
Portsmouth city | 100,565 | -5 | 95,535 | -1 | 95,027 | -5 | 90,715 |
Virginia Beach city | 425,257 | +3 | 437,994 | +4 | 457,699 | +2 | 467,187 |
Total Working Age Population:
Total Households:
Total Working Age Population:
Total Households:
Total Working Age Population:
Total Households: