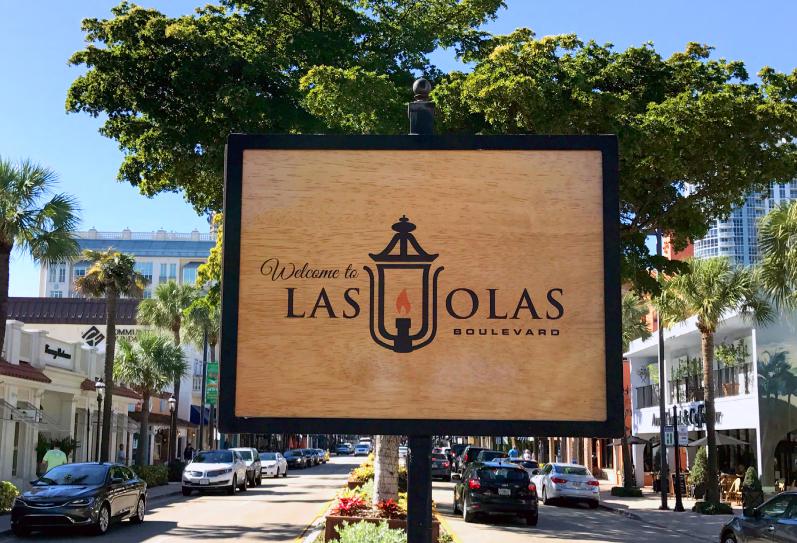
Las Olas Boulevard - Downtown Fort Lauderdale's Shopping, Dining + Lifestyle Destination
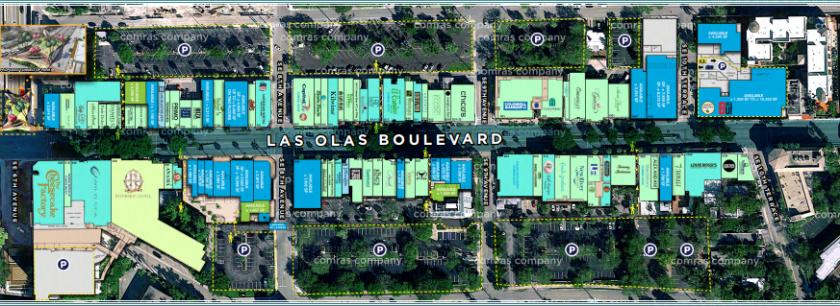
Las Olas Boulevard, situated in the heart of Fort Lauderdale’s downtown, is Broward County’s destination for shopping, dining and lifestyle. The beautifully tree lined street, is nestled between the Central Business District (CBD) at the New River Tunnel, proposed Tunnel Top Park, and the Himmarshee Canal. The five-block area boasts approximately 250,000 square feet of retail and café space, primarily in a series of low scale buildings, with individualized storefronts.
An urban, low scale, pedestrian friendly, walkable, café rich environment, adjacent to the Central Business District (CBD)
Easy access to I-95, Fort Lauderdale Airport and Port Everglades
Tourist destination with world class beaches, hotels, museums and art centers in the area
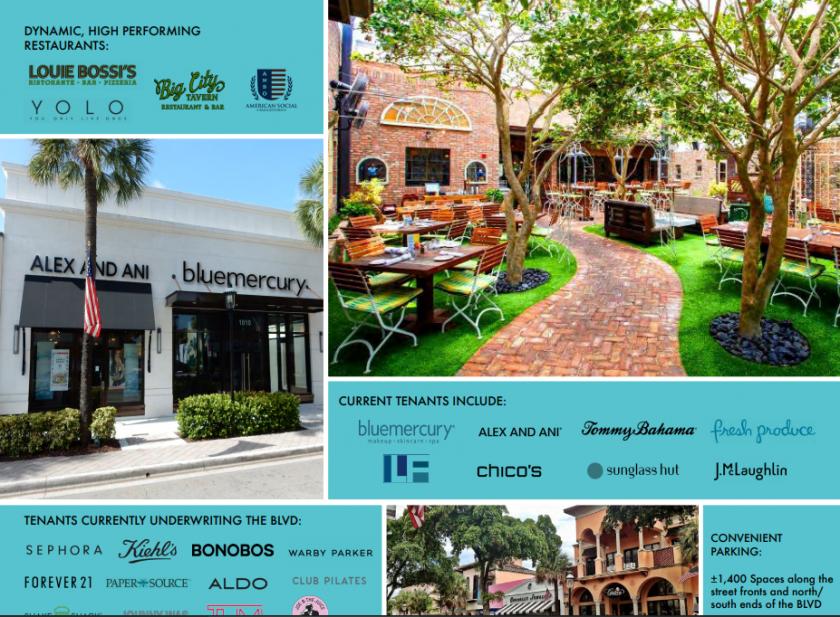
Perfect for fashion, boutiques, cafés, beauty, athleisure, blow-dry bar, home furnishings, accessories, galleries and specialty fitness facilities including pilates, yoga, spinning etc.
Existing and new tenants to the Boulevard include Blue Mercury, Alex and Ani, Big City Tavern, American Social, The Cheesecake Factory and Louie Bossi’s Ristorante
Unique façades with great visibility
Potential for dual loaded stores, with convenient parking in the rear
A curated, elevated tenant mix of national, regional and local brands
Ideally situated to meet the daily lifestyle needs of Ft. Lauderdale’s downtown community