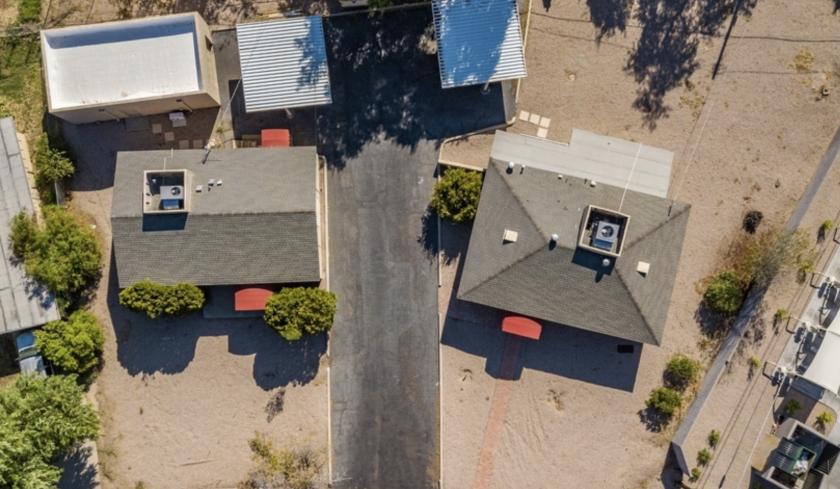
1-Mile | 3-Miles | 5-Miles | ||
---|---|---|---|---|
Total Population | 20,815 | 102,888 | 198,164 | |
Population Median Age | 40 | 41 | 39 | |
Population by Age | 0-9 Yrs | 1379 (6%) | 8634 (8%) | 18411 (9%) |
10-19 Yrs | 1512 (7%) | 7806 (7%) | 18436 (9%) | |
20-29 Yrs | 4918 (23%) | 20258 (19%) | 40082 (20%) | |
30-39 Yrs | 3844 (18%) | 16934 (16%) | 31373 (15%) | |
40-49 Yrs | 2541 (12%) | 11722 (11%) | 23140 (11%) | |
50-59 Yrs | 2117 (10%) | 13457 (13%) | 24397 (12%) | |
60-69 Yrs | 2068 (9%) | 11098 (10%) | 19812 (9%) | |
70+ Yrs | 2435 (11%) | 12980 (12%) | 22514 (11%) | |
Median HH Income | $63,282 | $68,162 | $63,385 | |
Total Household Income | < 24K | 1948 (17%) | 8426 (17%) | 16430 (18%) |
25-49K | 2538 (22%) | 9915 (20%) | 19654 (21%) | |
50-74K | 2077 (18%) | 8187 (16%) | 15102 (16%) | |
75-99K | 1713 (15%) | 6623 (13%) | 10394 (11%) | |
100-199K | 2146 (19%) | 11127 (22%) | 18852 (21%) | |
200K+ | 803 (7%) | 4584 (9%) | 9302 (10%) | |
Highest Education Level | No Diploma | 818 | 4585 | 11176 |
Diploma or GED | 2559 | 12275 | 23469 | |
Some College | 3282 | 17696 | 32630 | |
Assoc. Degree | 1013 | 5709 | 9866 | |
Bachelors Degree | 5657 | 25871 | 43030 | |
Higher Degree | 2648 | 12705 | 23965 | |
Total Housing Units | 13,887 | 57,294 | 104,130 | |
--Owner-Occupied | 4,244 | 26,836 | 45,351 | |
--Renter-Occupied | 6,981 | 22,027 | 44,383 | |
Owner-Occupied Values | < 100K | 130 | 1881 | 3958 |
100-199K | 1074 | 3861 | 5729 | |
200-299K | 1013 | 6038 | 8305 | |
300-399K | 1055 | 6744 | 9207 | |
400-499K | 496 | 3357 | 5626 | |
500K+ | 475 | 4955 | 12526 | |
Total Working Age Population | 18,423 | 89,237 | 169,971 | |
In Work Force | 13,350 | 62,089 | 117,153 | |
Not In Work Force | 5,073 | 27,148 | 52,819 | |
Workforce Employed | 12,752 | 60,094 | 112,324 | |
Workforce Unemployed | 598 | 1,901 | 4,551 | |
Civlian Workforce | 13,350 | 61,994 | 116,876 | |
Military Workforce | 0 | 95 | 277 | |
Total Households | 11,224 | 48,863 | 89,734 | |
Family Households | 3,734 | 21,036 | 41,422 | |
Non-Family Households | 7,491 | 27,826 | 48,312 | |
Married Couple | 2,698 | 14,954 | 28,555 | |
Other Family | 1,036 | 6,083 | 12,868 | |
Married w/Child | 694 | 4,538 | 9,361 | |
Single Male w/Child | 67 | 650 | 1,543 | |
Single Female w/Child | 349 | 1,730 | 3,750 |
Population Change Last Two Decades - Plus Projection
2000 | % | 2010 | % | 2020 | % | 2030 | |
---|---|---|---|---|---|---|---|
Arizona | 5,130,632 | +25 | 6,392,017 | +14 | 7,286,100 | +14 | 8,284,900 |
Maricopa County | 3,072,149 | +24 | 3,817,117 | +16 | 4,436,900 | +15 | 5,107,700 |
Pinal County | 179,727 | +109 | 375,770 | +24 | 466,200 | +32 | 616,200 |
Total Working Age Population:
Total Households:
Total Working Age Population:
Total Households:
Total Working Age Population:
Total Households: