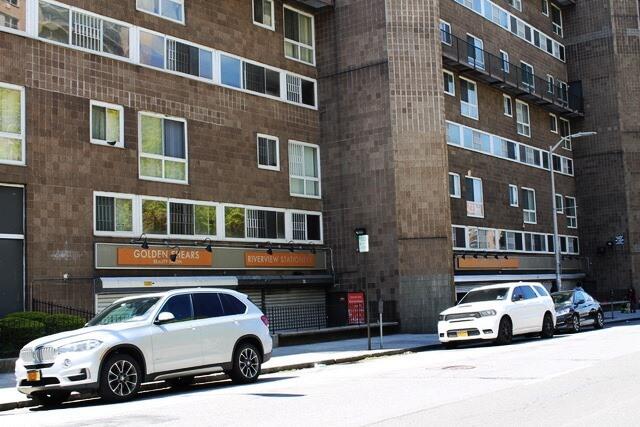
Yonkers Retail Space for Lease. Three (3) prime ground level spaces in Multi-Family Building. Each space is 806 square feet. Additionally, pricing is offered at $2,200 per month modified gross.
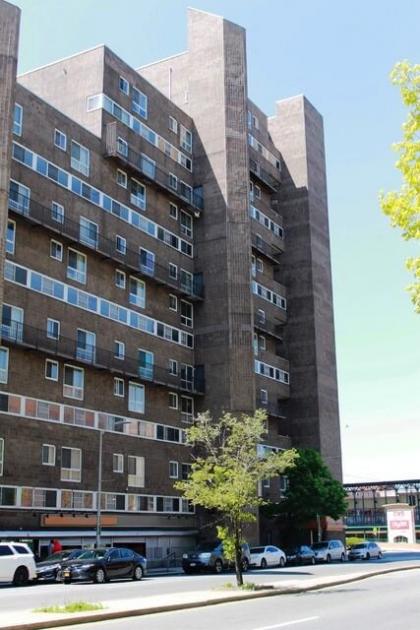
This building features 343 residential apartments. Further, there are more than 1,000 residential residents. The site is located on busy Riverdale Avenue connecting the towns of Yonkers and Riverdale. It is also across from CVS and ShopRite grocery store. Additionally, it is in close proximity to St. Joseph’s Medical Center. Above all, it is near the vibrant Yonkers downtown area and Getty Square and the Hudson River Waterfront.
There Yonkers retail space has a fantastic opportunity for signage visibility. Additional uses include office, bank, medical, and urgent care.
Building Features 343 Apartments with More than 1,000 Residents
Across from CVS & ShopRite
Close Proximity to
St. Joseph’s Medical Center
Retail, Office, Bank, Medical & Urgent Care Uses Allowed
Close to Getty Square and Hudson River Waterfront
On Busy Riverdale Avenue Connecting Yonkers to Riverdale
Fantastic Signage Visibility
No part of this information may be copied, reproduced, repurposed, or screen-captured for any commercial purpose without prior written authorization from MyEListing.
While we strive to provide the most accurate information, all listing information, and demographic data, is provided by third-parties. As such, MyEListing will not be responsible for the accuracy of the information. It is strongly recommended that you verify all information with the listing agent, and any relevant agencies, prior to making any decisions.
What is the asking price for 47 Riverdale Avenue in Yonkers?
The asking price for 47 Riverdale Avenue is $32.75 a SF per Year
What is the building size of this commercial Retail property?
The size of this lease property at '.47 Riverdale Avenue.' is 806 square feet
What kind of Retail is the propery at 47 Riverdale Avenue?
The property at 47 Riverdale Avenue Yonkers, NY 10701 is listed as a Shopping Center Retail property
What is the population within 1 mile of 47 Riverdale Avenue in Yonkers?
The population within 1 mile of 47 Riverdale Avenue Yonkers, NY 10701 is 63,799 people.
Who do I contact for questions about 47 Riverdale Avenue?
You should contact the listing agent,
Admiral Real Estate, for any details regarding this commercial listing.