There is 540 square feet of Soundview retail located at 1204 Elder Avenue. This space is currently built-out as a hair salon. In addition to retail use, other permitted uses include general retail, office, medical and urgent care.
LOCATION, LOCATION, LOCATION
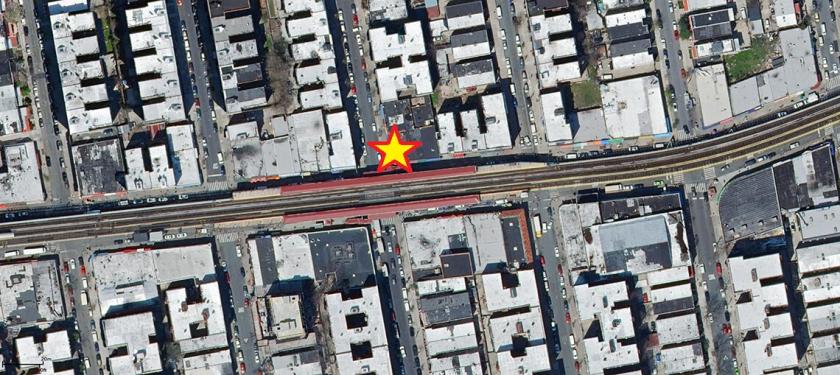
This site is situated in an ultra prime location on Elder Avenue within steps of the Elder Ave MTA #6 train. Additionally, it lies within the corner of Westchester Ave, an exceptionally busy retail corridor. Further, there are two MTA bus stops within one block.
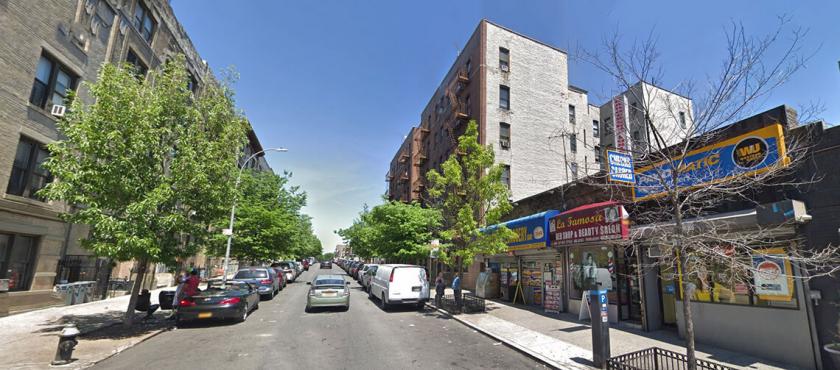
The area is also very residentially dense. Most importantly, the corner is highlighted with other major retailers and services like Rite Aid, Papa John’s and Burger Hut.
VISIBILITY, PARKING AND VEHICLE TRAFFIC
This Soundview retail site is exceptionally visible. It can be seen from the train station and the busy corner of Elder and Westchester Avenues. Further, the sidewalk is completely open with no trees blocking the storefront view.
Street parking is available on all nearby streets. Additionally, one of the Elder Avenue parking meters is directly in front of the location.
The retail or office space is an excellent location for vehicle traffic, as it is situated in the center of the radius of I-95, the Bronx River Parkway, Bronx River Avenue, and I-278 (and aligning Bruckner Blvd).
QUICK FACTS
• Currently built-out as hair salon
• Additional uses permitted: General retail, office, medical, and urgent care
• Steps from MTA Elder Ave #6 subway train station; Bus stop at corner of Westchester Avenue
• Dense retail and residential area
• Shares corner with Rite Aid, Papa John’s & Burger Hut
• Great visibility on busy street; Corner of Westchester Avenue
• Metered parking directly in front of site
• Excellent location for vehicle traffic; Site is located in the middle of I-95, the Bronx River Parkway, Bronx River Avenue, and I-278, which runs in-line with Bruckner Blvd*
OFFERED RATE
This opportunity is offered at $40 PSF. Taxes are $15 PSF. Electricity and water are directly metered to the space and paid for by the tenant.