Close proximity to Sentara Leigh Hospital and Sentara and Virginia Oncology’s new 170,000 SF cancer center
Centrally located with immediate proximity to
I-64 and I-264, Newtown Rd Light Rail and HRBT stop
Two Spaces Available for Lease - 8,500SF and 5,500SF
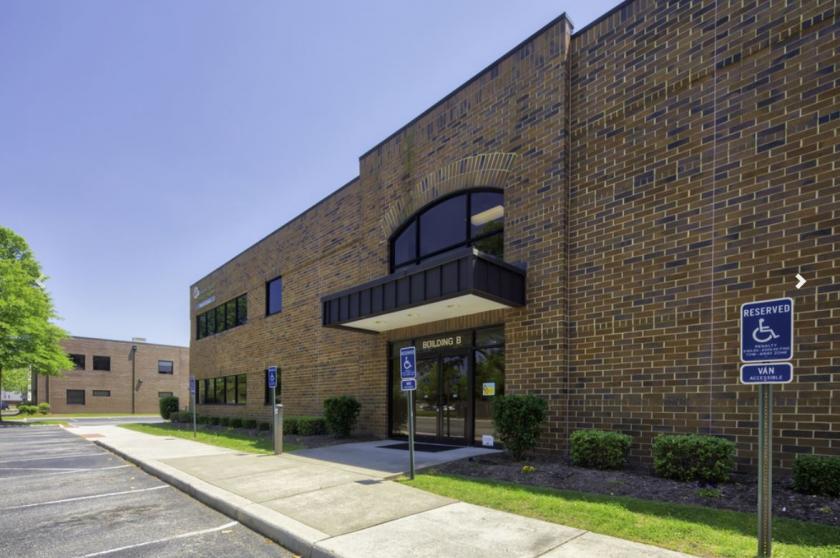
20,000 SF Available Built to Suit w/ 3 Points of Ingress/Egress & Median Break on Kempsville
181 Surface Parking Spaces – 5.3 per 1000
Generous Construction Allowance
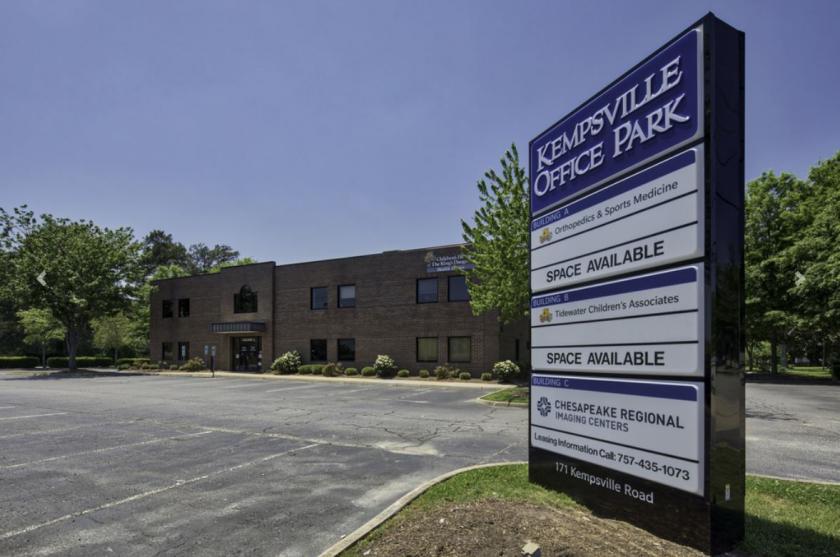
Monument and Building Signage Available
No part of this information may be copied, reproduced, repurposed, or screen-captured for any commercial purpose without prior written authorization from MyEListing.
While we strive to provide the most accurate information, all listing information, and demographic data, is provided by third-parties. As such, MyEListing will not be responsible for the accuracy of the information. It is strongly recommended that you verify all information with the listing agent, and any relevant agencies, prior to making any decisions.
What is the asking price for 171 Kempsville Road in Norfolk?
The asking price for 171 Kempsville Road is $20.00 a SF per Year
What is the building size of this commercial Office property?
The size of this lease property at '.171 Kempsville Road.' is 37000 square feet
What kind of Office is the propery at 171 Kempsville Road?
The property at 171 Kempsville Road Norfolk, VA 23502 is listed as a Medical Office property
What is the population within 1 mile of 171 Kempsville Road in Norfolk?
The population within 1 mile of 171 Kempsville Road Norfolk, VA 23502 is 8,633 people.
Who do I contact for questions about 171 Kempsville Road?
You should contact the listing agent,
Chris Zarpas, for any details regarding this commercial listing.