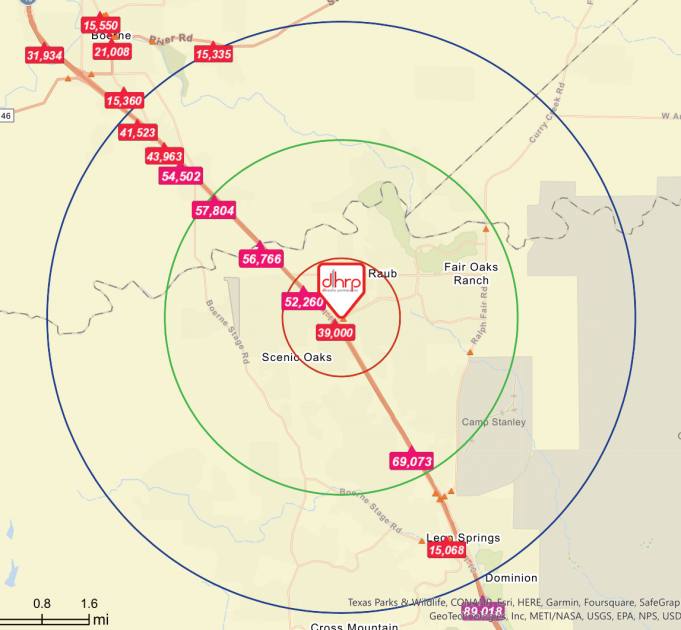
Retail Space
9091 Fair Oaks Parkway Boerne, TX 78015
9091 Fair Oaks Parkway Boerne, TX 78015
Details & Description
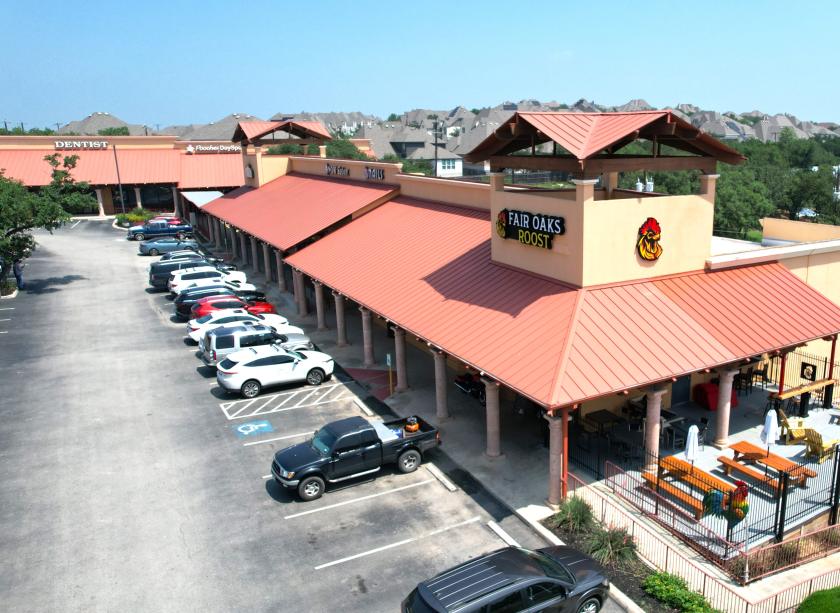
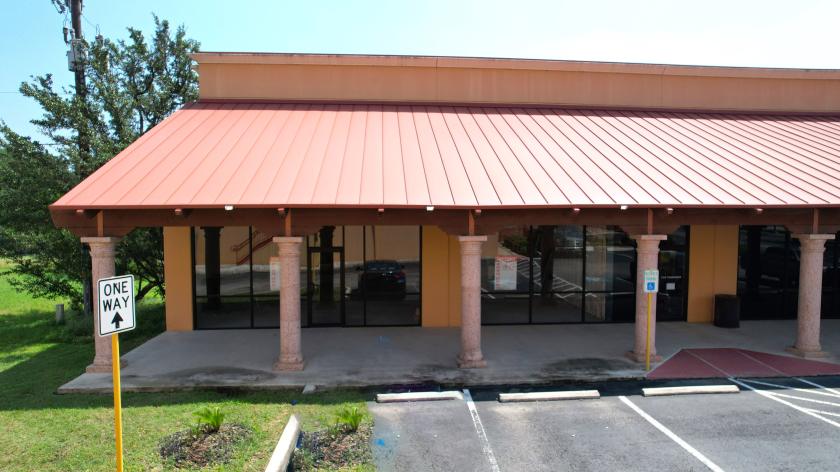
Additional Photos


Listing Agents

Alex Yount
O: 210-222-2424
ayount@dhrp.us
O: 210-222-2424
ayount@dhrp.us

Logan Baylor
DH Realty Partners
O: 210-222-2424
M: 210-326-1095
lbaylor@dhrp.us
DH Realty Partners
O: 210-222-2424
M: 210-326-1095
lbaylor@dhrp.us
While we strive to provide the most accurate information, all listing information, and demographic data, is provided by third-parties. As such, MyEListing will not be responsible for the accuracy of the information. It is strongly recommended that you verify all information with the listing agent, and any relevant agencies, prior to making any decisions.