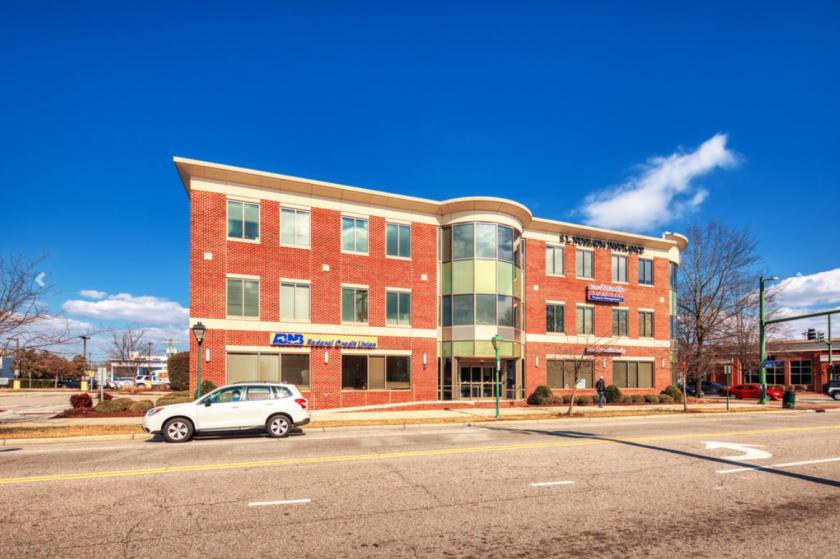
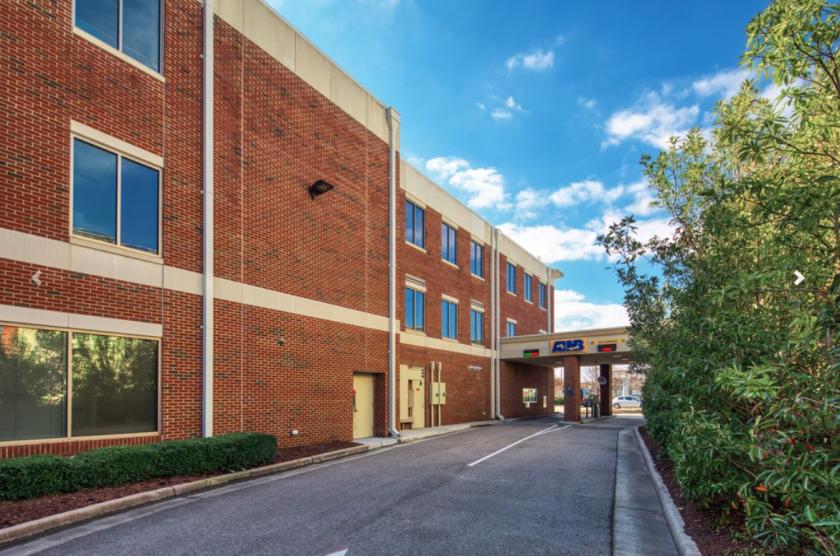
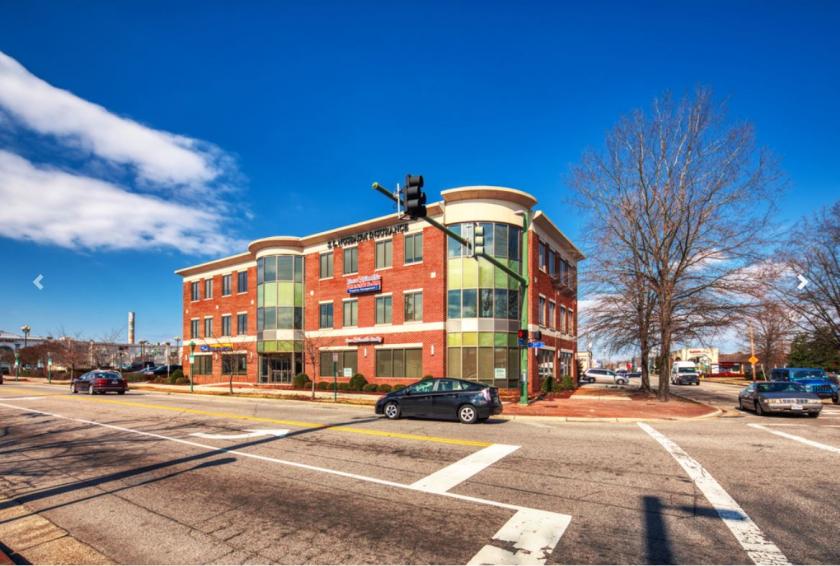
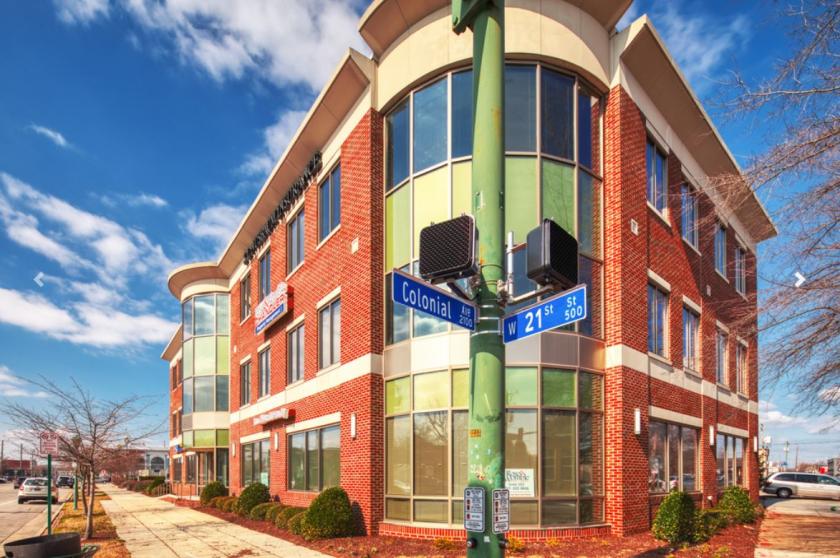
1-Mile | 3-Miles | 5-Miles | ||
---|---|---|---|---|
Total Population | 23,262 | 132,564 | 301,646 | |
Population Median Age | 36 | 36 | 35 | |
Population by Age | 0-9 Yrs | 2380 (10%) | 14528 (10%) | 38451 (12%) |
10-19 Yrs | 2153 (9%) | 17173 (12%) | 36918 (12%) | |
20-29 Yrs | 6547 (28%) | 31231 (23%) | 69700 (23%) | |
30-39 Yrs | 3611 (15%) | 18535 (13%) | 42477 (14%) | |
40-49 Yrs | 2342 (10%) | 13577 (10%) | 30379 (10%) | |
50-59 Yrs | 2256 (9%) | 14927 (11%) | 33126 (10%) | |
60-69 Yrs | 2100 (9%) | 12597 (9%) | 28366 (9%) | |
70+ Yrs | 1874 (8%) | 9996 (7%) | 22231 (7%) | |
Median HH Income | $54,986 | $55,077 | $52,169 | |
Total Household Income | < 24K | 2661 (26%) | 12582 (25%) | 26852 (24%) |
25-49K | 1957 (19%) | 10378 (20%) | 25419 (23%) | |
50-74K | 1587 (16%) | 8222 (16%) | 20577 (18%) | |
75-99K | 1119 (11%) | 6088 (12%) | 13000 (11%) | |
100-199K | 1930 (19%) | 9216 (18%) | 17919 (16%) | |
200K+ | 650 (6%) | 3380 (6%) | 4907 (4%) | |
Highest Education Level | No Diploma | 1455 | 9149 | 22828 |
Diploma or GED | 2958 | 17854 | 48052 | |
Some College | 2959 | 18115 | 46734 | |
Assoc. Degree | 818 | 5756 | 15389 | |
Bachelors Degree | 3786 | 17627 | 31990 | |
Higher Degree | 3502 | 14722 | 21995 | |
Total Housing Units | 11,033 | 56,333 | 121,425 | |
--Owner-Occupied | 3,213 | 22,459 | 50,817 | |
--Renter-Occupied | 6,691 | 27,408 | 57,859 | |
Owner-Occupied Values | < 100K | 247 | 1603 | 3979 |
100-199K | 767 | 7158 | 20705 | |
200-299K | 717 | 5716 | 14926 | |
300-399K | 614 | 3105 | 4630 | |
400-499K | 355 | 1860 | 2567 | |
500K+ | 513 | 3017 | 4010 | |
Total Working Age Population | 19,741 | 110,310 | 243,750 | |
In Work Force | 13,397 | 72,361 | 165,271 | |
Not In Work Force | 6,344 | 37,949 | 78,479 | |
Workforce Employed | 11,384 | 60,104 | 127,222 | |
Workforce Unemployed | 824 | 5,550 | 11,115 | |
Civlian Workforce | 12,207 | 65,653 | 138,337 | |
Military Workforce | 1,189 | 6,708 | 26,934 | |
Total Households | 9,903 | 49,866 | 108,676 | |
Family Households | 4,346 | 26,881 | 63,952 | |
Non-Family Households | 5,558 | 22,986 | 44,723 | |
Married Couple | 2,807 | 16,868 | 38,145 | |
Other Family | 1,539 | 10,013 | 25,807 | |
Married w/Child | 1,047 | 6,342 | 15,079 | |
Single Male w/Child | 83 | 994 | 2,550 | |
Single Female w/Child | 849 | 4,763 | 11,764 |
Population Change Last Two Decades - Plus Projection
2000 | % | 2010 | % | 2020 | % | 2030 | |
---|---|---|---|---|---|---|---|
Virginia | 7,078,515 | +13 | 8,001,024 | +8 | 8,655,021 | +8 | 9,331,666 |
Chesapeake city | 199,184 | +12 | 222,209 | +12 | 249,244 | +9 | 270,506 |
Hampton city | 146,437 | -6 | 137,436 | -1 | 135,530 | -6 | 127,842 |
Norfolk city | 234,403 | +4 | 242,803 | +2 | 246,881 | +1 | 249,889 |
Portsmouth city | 100,565 | -5 | 95,535 | -1 | 95,027 | -5 | 90,715 |
Virginia Beach city | 425,257 | +3 | 437,994 | +4 | 457,699 | +2 | 467,187 |
Total Working Age Population:
Total Households:
Total Working Age Population:
Total Households:
Total Working Age Population:
Total Households: