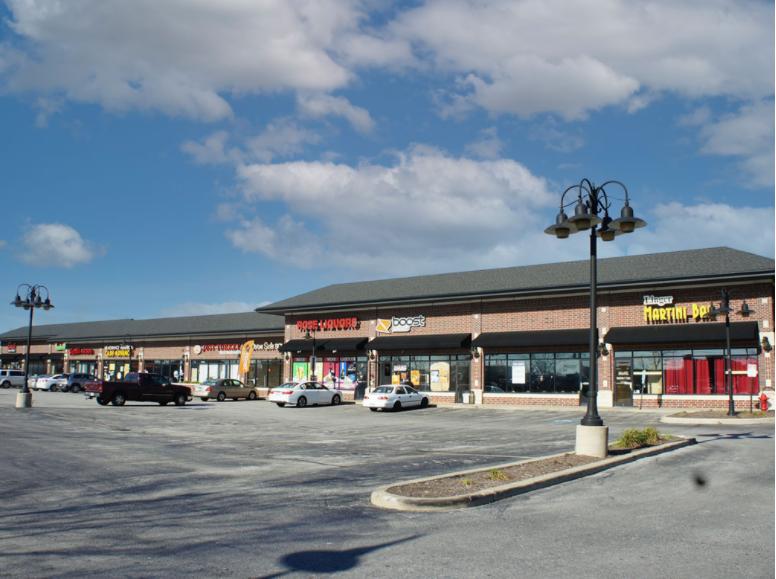
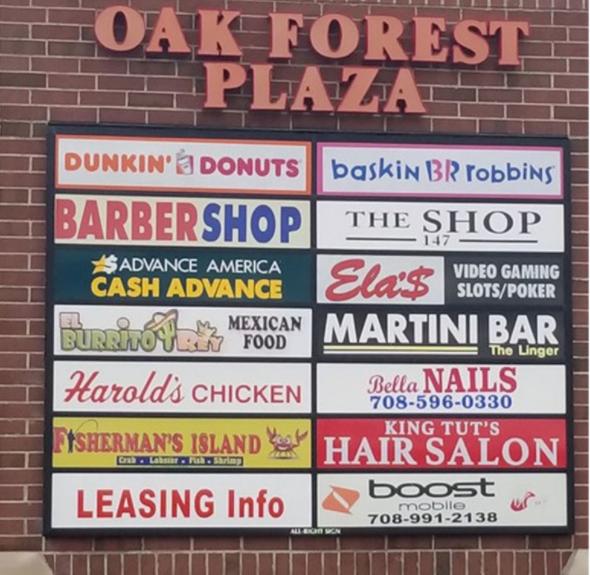
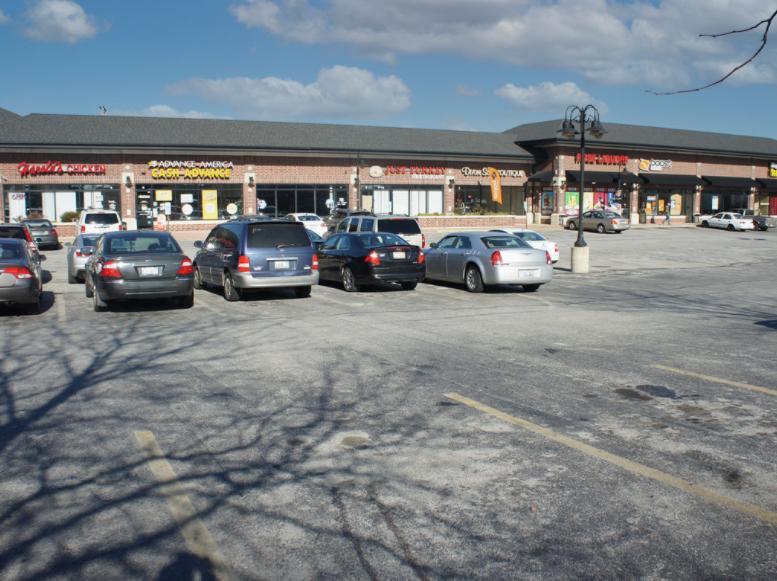
1-Mile | 3-Miles | 5-Miles | ||
---|---|---|---|---|
Total Population | 6,703 | 85,254 | 216,831 | |
Population Median Age | 38 | 39 | 39 | |
Population by Age | 0-9 Yrs | 834 (12%) | 9480 (11%) | 25949 (11%) |
10-19 Yrs | 1026 (15%) | 12820 (15%) | 30014 (13%) | |
20-29 Yrs | 783 (11%) | 11350 (13%) | 27891 (12%) | |
30-39 Yrs | 889 (13%) | 9831 (11%) | 26226 (12%) | |
40-49 Yrs | 929 (13%) | 11648 (13%) | 27039 (12%) | |
50-59 Yrs | 826 (12%) | 11828 (13%) | 30053 (13%) | |
60-69 Yrs | 839 (12%) | 10453 (12%) | 26410 (12%) | |
70+ Yrs | 576 (8%) | 7844 (9%) | 23249 (10%) | |
Median HH Income | $66,954 | $59,471 | $60,913 | |
Total Household Income | < 24K | 382 (16%) | 5809 (19%) | 15864 (19%) |
25-49K | 394 (17%) | 6820 (22%) | 17042 (21%) | |
50-74K | 509 (22%) | 5741 (18%) | 14924 (18%) | |
75-99K | 439 (19%) | 4483 (14%) | 11138 (13%) | |
100-199K | 498 (21%) | 6718 (22%) | 17524 (21%) | |
200K+ | 51 (2%) | 782 (2%) | 3270 (4%) | |
Highest Education Level | No Diploma | 443 | 5569 | 14691 |
Diploma or GED | 1580 | 16848 | 41526 | |
Some College | 1094 | 15603 | 38610 | |
Assoc. Degree | 466 | 5098 | 12380 | |
Bachelors Degree | 631 | 9523 | 25000 | |
Higher Degree | 275 | 4751 | 14837 | |
Total Housing Units | 2,586 | 33,292 | 88,670 | |
--Owner-Occupied | 1,708 | 21,463 | 57,726 | |
--Renter-Occupied | 565 | 8,889 | 22,035 | |
Owner-Occupied Values | < 100K | 455 | 5534 | 13967 |
100-199K | 964 | 10955 | 26180 | |
200-299K | 260 | 3942 | 13374 | |
300-399K | 14 | 743 | 2773 | |
400-499K | 10 | 134 | 730 | |
500K+ | 5 | 156 | 702 | |
Total Working Age Population | 5,207 | 67,961 | 172,217 | |
In Work Force | 3,546 | 43,225 | 108,303 | |
Not In Work Force | 1,661 | 24,736 | 63,914 | |
Workforce Employed | 3,224 | 38,710 | 98,176 | |
Workforce Unemployed | 322 | 4,515 | 10,116 | |
Civlian Workforce | 3,546 | 43,225 | 108,292 | |
Military Workforce | 0 | 0 | 11 | |
Total Households | 2,273 | 30,352 | 79,761 | |
Family Households | 1,660 | 20,363 | 51,499 | |
Non-Family Households | 613 | 9,989 | 28,262 | |
Married Couple | 1,094 | 12,209 | 32,997 | |
Other Family | 566 | 8,154 | 18,502 | |
Married w/Child | 377 | 4,553 | 12,088 | |
Single Male w/Child | 56 | 796 | 1,909 | |
Single Female w/Child | 211 | 2,879 | 6,737 |
Population Change Last Two Decades - Plus Projection
2000 | % | 2010 | % | 2020 | % | 2030 | |
---|---|---|---|---|---|---|---|
Illinois | 12,419,293 | +3 | 12,830,632 | +12 | 14,316,487 | +6 | 15,138,849 |
Cook County | 5,376,741 | -3 | 5,194,675 | +10 | 5,707,832 | +5 | 5,990,243 |
Will County | 502,266 | +35 | 677,560 | +34 | 907,625 | +20 | 1,093,207 |
Total Working Age Population:
Total Households:
Total Working Age Population:
Total Households:
Total Working Age Population:
Total Households: