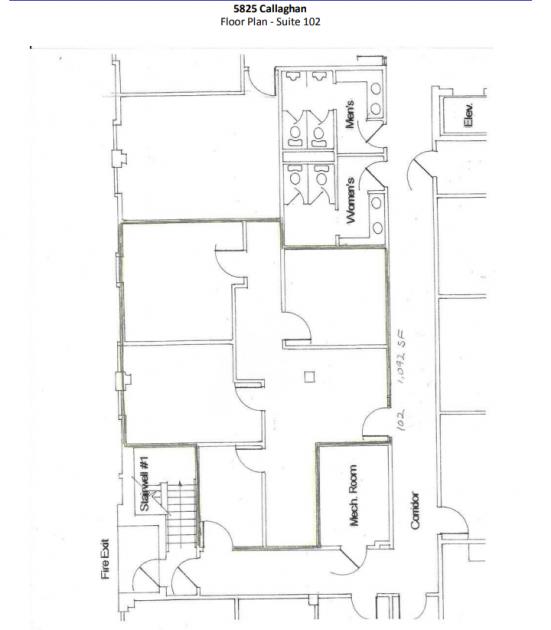
1
st Floor 102 1,092 SF ($1,650/Month)
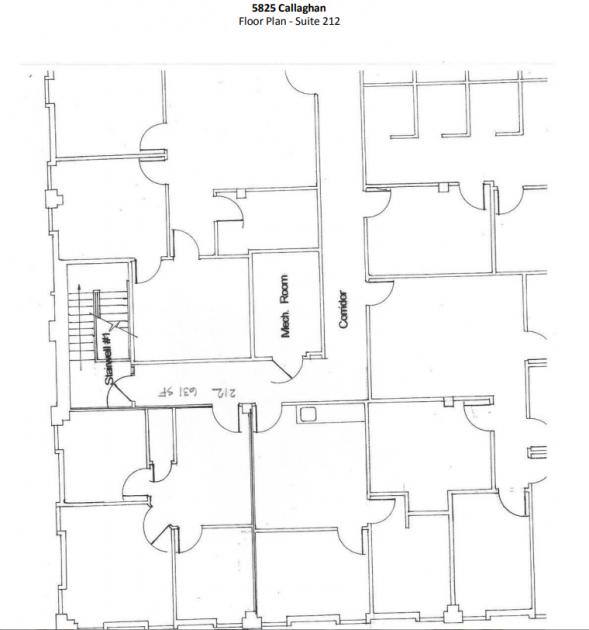
2
nd Floor 204 1,662 SF ($2,500/Month)
209 500 SF ($ 800/Month)
212 631 SF ($1,000/Month)
Low-rise, suburban office building in great location
with easy access to IH-10 and Loop 410.
• Professional, on-site management
• Abundant parking
• After hours HVAC
• Attractive small spaces — move-in ready
• Dining & shopping close by
No part of this information may be copied, reproduced, repurposed, or screen-captured for any commercial purpose without prior written authorization from MyEListing.
While we strive to provide the most accurate information, all listing information, and demographic data, is provided by third-parties. As such, MyEListing will not be responsible for the accuracy of the information. It is strongly recommended that you verify all information with the listing agent, and any relevant agencies, prior to making any decisions.
What is the building size of this commercial Office property?
The size of this multi-unit property varies between 500 - 1662 square feet
What kind of Office is the propery at 5825 Callaghan Road?
The property at 5825 Callaghan Road San Antonio, TX 78228 is listed as a Professional Office property
What is the population within 1 mile of 5825 Callaghan Road in San Antonio?
The population within 1 mile of 5825 Callaghan Road San Antonio, TX 78228 is 14,298 people.
Who do I contact for questions about 5825 Callaghan Road?
You should contact the listing agent,
Dan Gostylo, for any details regarding this commercial listing.