? 2 miles from the University of Arizona, downtown Tucson and the
Tucson International Airport.
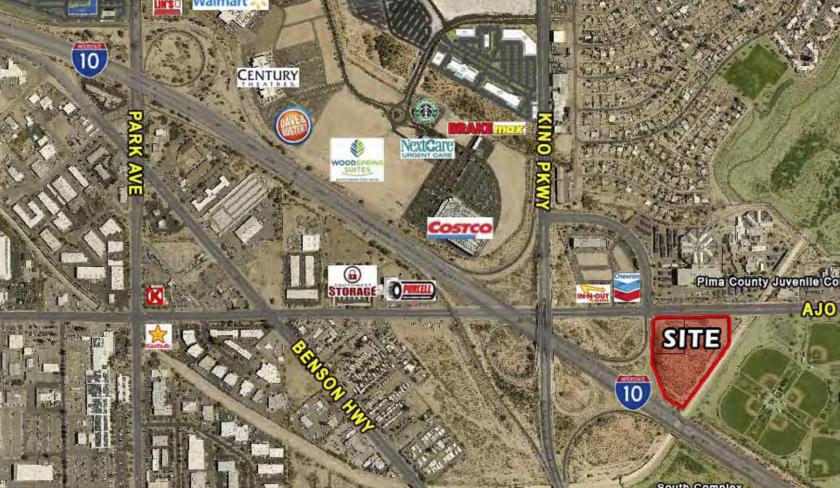
?? Intersection of three highways, on I-10 off ramp.
?? Next to ±100 acre Kino Sports Complex.
?? Next to Banner University Medical Center South Campus
?? Next to ± 350-acre The Bridges master plan development that includes:
?? ±350,000 SF Tucson Marketplace at The Bridges (up to
1,000,000 SF).
?? 120,000 SF The Refinery, Phase I of the ±3,000,000 SF UA Tech
Park at The Bridges.
?? ±200,000 SF Geico Regional Headquarters building with ±2,000
employees.
?? 50,000 SF (up to 150,000 SF) JTED - Joint Technical Educational
Facility, with ±25,000 students in first phase.
No part of this information may be copied, reproduced, repurposed, or screen-captured for any commercial purpose without prior written authorization from MyEListing.
While we strive to provide the most accurate information, all listing information, and demographic data, is provided by third-parties. As such, MyEListing will not be responsible for the accuracy of the information. It is strongly recommended that you verify all information with the listing agent, and any relevant agencies, prior to making any decisions.
What is the building size of this commercial Retail property?
The size of this multi-unit property varies between 38675 - 61751 square feet
What kind of Retail is the propery at 2100 East Ajo Way?
The property at 2100 East Ajo Way Tucson, AZ 85713 is listed as a Shopping Center Retail property
What is the population within 1 mile of 2100 East Ajo Way in Tucson?
The population within 1 mile of 2100 East Ajo Way Tucson, AZ 85713 is 8,404 people.
Who do I contact for questions about 2100 East Ajo Way?
You should contact the listing agent,
Craig Finfrock, for any details regarding this commercial listing.