High floors, 3,000 sf, 2,500 sf, 5,500 sf, 7,500 sf.
1. Great Views and Location, Energy Star Labeled 24/7 Access.
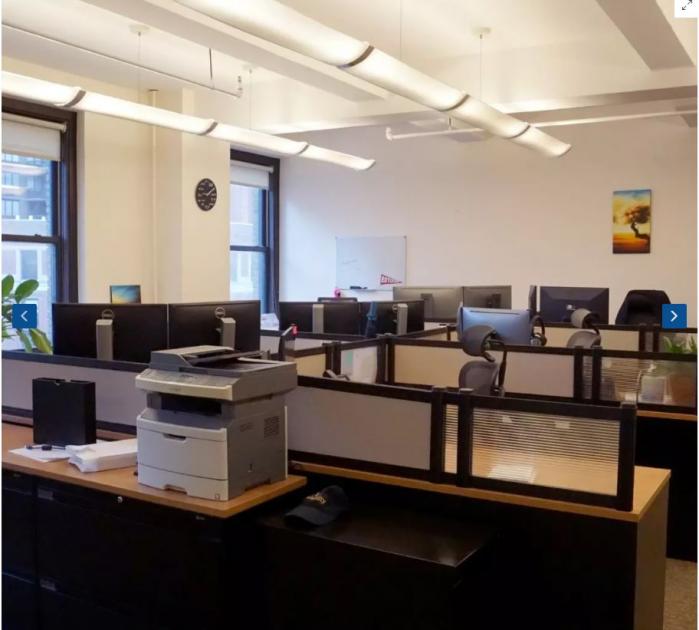
1 Executive Office, Desks for 25, 2 Meeting Rooms, 2 Pantries.
Dedicated Reception, Large Conference Room.
Multiple Divisions available.
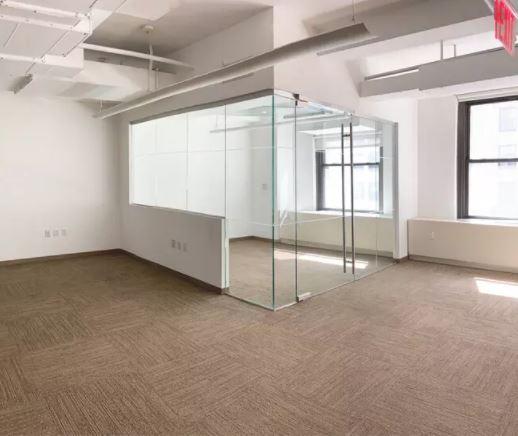
2. Space is ready – Carpet throughout – Glass-fronted office – Glass common corridor – 2 Private bathrooms
– ADA bathroom – LED lights – Views into Times square down Broadway Wide-open space with high ceilings, conference room,
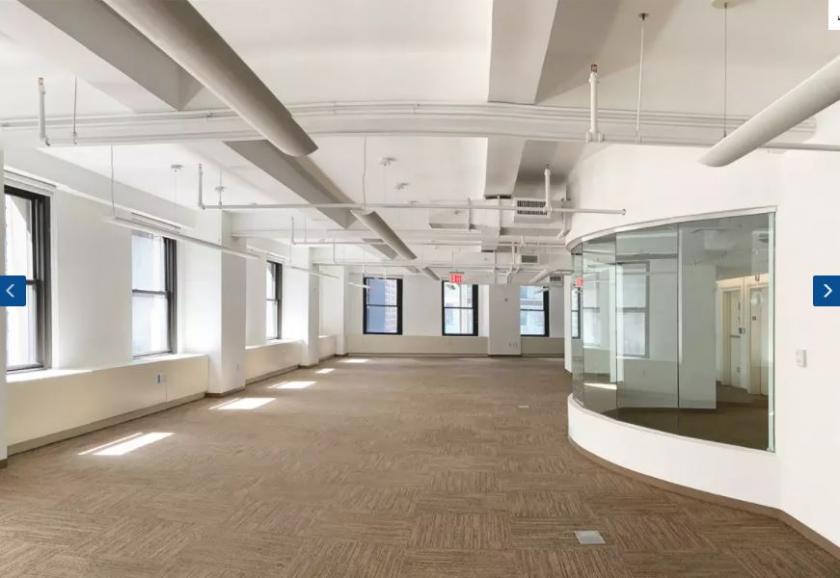
3. Space is ready – 1 Conference room – 3 offices with good lighting –
Executive office with views of Hudson River – IT/copy room – Waiting area –
New wet pantry – Views into Times square down Broadway.
No part of this information may be copied, reproduced, repurposed, or screen-captured for any commercial purpose without prior written authorization from MyEListing.
While we strive to provide the most accurate information, all listing information, and demographic data, is provided by third-parties. As such, MyEListing will not be responsible for the accuracy of the information. It is strongly recommended that you verify all information with the listing agent, and any relevant agencies, prior to making any decisions.
What is the building size of this commercial Office property?
The size of this multi-unit property varies between 2500 - 5500 square feet
What kind of Office is the propery at 1000 8th Ave?
The property at 1000 8th Ave New York, NY 10019 is listed as a Professional Office property
What is the population within 1 mile of 1000 8th Ave in New York?
The population within 1 mile of 1000 8th Ave New York, NY 10019 is 159,676 people.
Who do I contact for questions about 1000 8th Ave?
You should contact the listing agent,
Don Schmidt, for any details regarding this commercial listing.