Located on 33rd street between Fifth avenue, Broadway
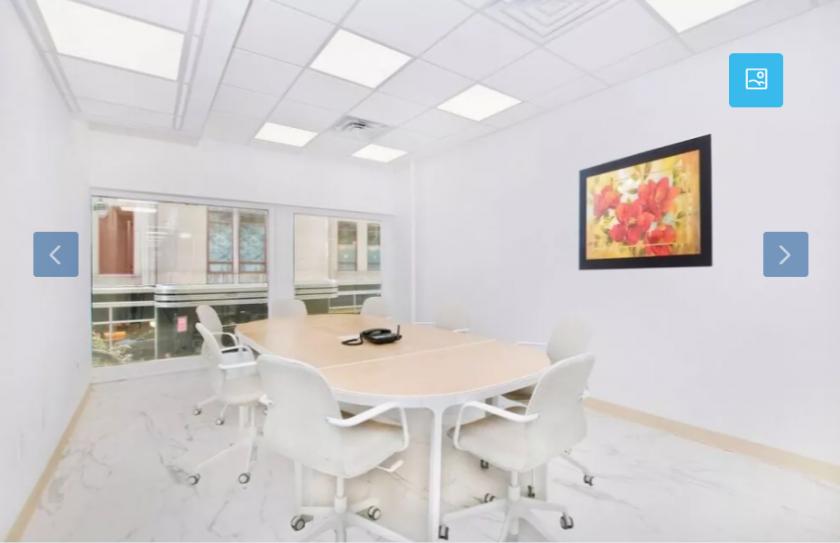
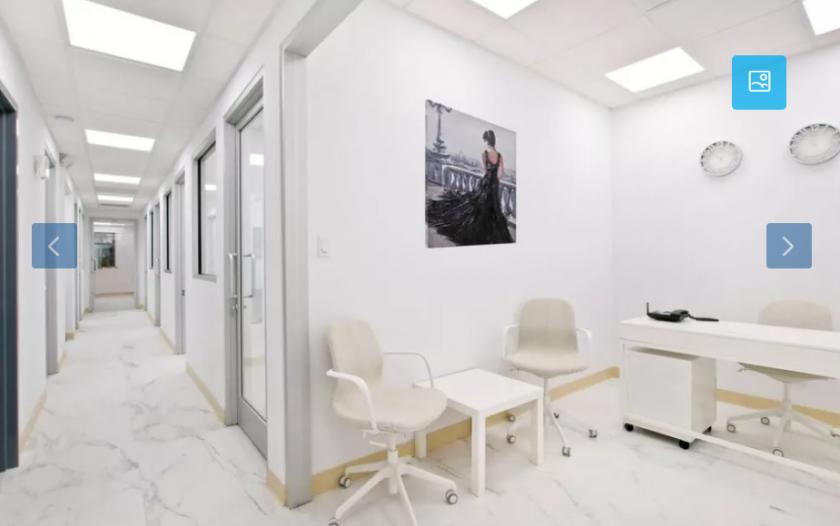
In the heart of Midtown Manhattan” Newly renovated
Furnished or unfurnished ** Front Desk Receptionist
internet & WIFI, Copy /Printing Room limited free pages
VoIP Phones ( optional) $40 per line, one time setup fee
24 Hour Access *Biometric Access, Elevator Key Deposit $100
Kitchen ( Microwave, Coffee Machine, Kettle, Fridge)
Cleaning Fee $100 Monthly *** Conference Room (limited free access + 45 per hour)
Transportation: Steps to Penn station, Herald Square
Grand Central Terminal, Path, Port Authority Bus Terminal
16 Subway Lines ( A,C, E, B, D, F, M, N, Q, R, W, 1, 2, 3, 4, 5, 6 )
Transportation around 18 W 33rd St, New York, NY 10001 Herald Square
Herald Square is accessible and comfortable by walking. The public transportation is accessible by its own subway station: the 34th Street – Herald Square station, which is served by the B, D, F, M, N, Q, R, and W trains. Travelers can also use the nearby 33rd Street Station, served by the PATH. Herald Square is excellently located close to Port Authority, Pennsylvania Station, and Grand Central Terminal – one of the busiest transportation hubs in NYC and the most visited tourist attractions in the world. Penn Station also provides access to the 1, 2, and 3 trains, as well as Amtrak train service for commuters.
Please Call Ed Fritsche at 845-430-4750
ed@rimanhattan.com