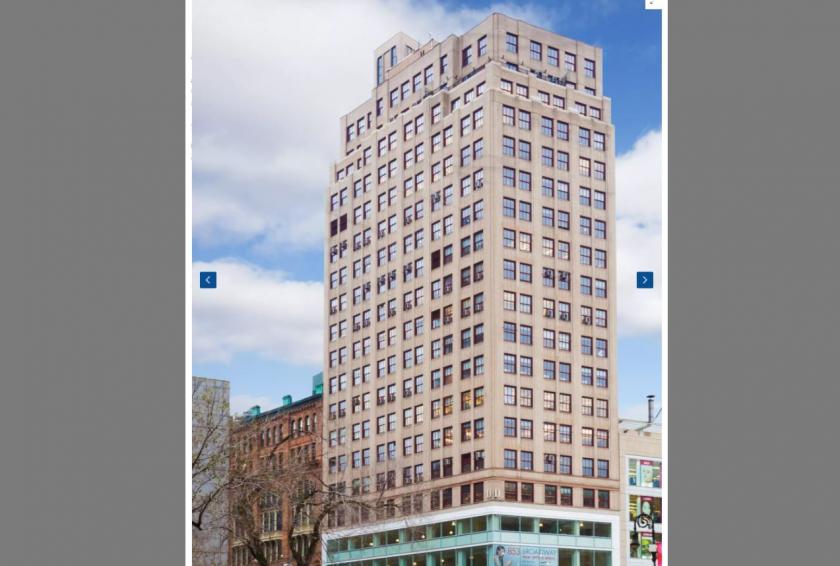
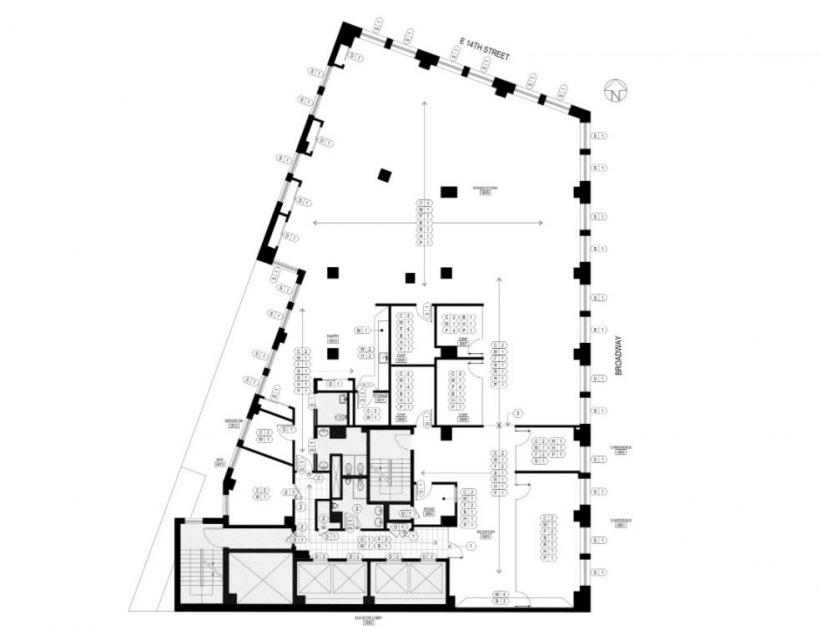
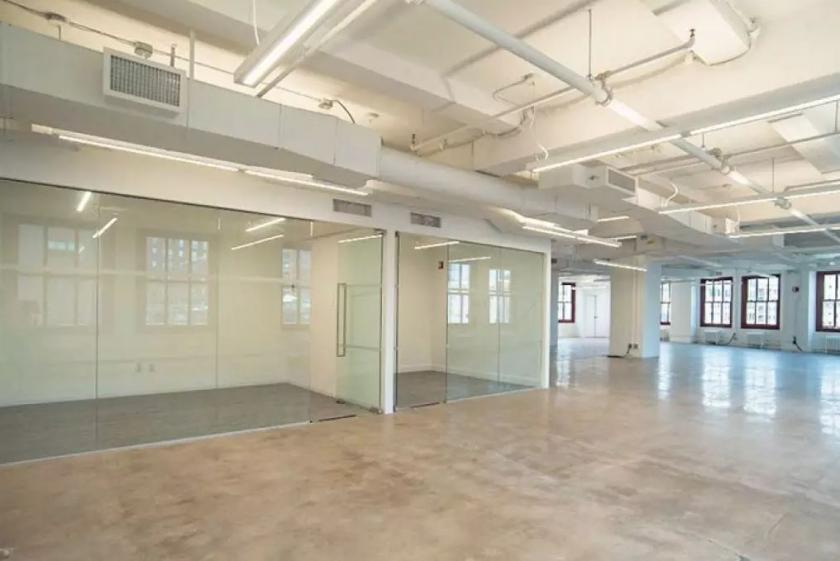
1-Mile | 3-Miles | 5-Miles | ||
---|---|---|---|---|
Total Population | 264,404 | 1,158,139 | 2,717,139 | |
Population Median Age | 40 | 39 | 38 | |
Population by Age | 0-9 Yrs | 14092 (5%) | 103976 (8%) | 283556 (10%) |
10-19 Yrs | 19127 (7%) | 76137 (6%) | 213218 (7%) | |
20-29 Yrs | 65028 (24%) | 231929 (20%) | 498410 (18%) | |
30-39 Yrs | 54250 (20%) | 268179 (23%) | 570072 (20%) | |
40-49 Yrs | 31249 (11%) | 148773 (12%) | 354615 (13%) | |
50-59 Yrs | 28805 (10%) | 118173 (10%) | 294704 (10%) | |
60-69 Yrs | 26408 (9%) | 104203 (8%) | 250844 (9%) | |
70+ Yrs | 25444 (9%) | 106770 (9%) | 251721 (9%) | |
Median HH Income | $114,277 | $115,000 | $92,566 | |
Total Household Income | < 24K | 20919 (14%) | 93709 (16%) | 224306 (18%) |
25-49K | 14768 (10%) | 59886 (10%) | 159482 (13%) | |
50-74K | 14519 (10%) | 52931 (9%) | 140208 (11%) | |
75-99K | 13186 (9%) | 50058 (8%) | 121905 (9%) | |
100-199K | 35610 (25%) | 148469 (26%) | 304757 (24%) | |
200K+ | 40918 (29%) | 164560 (28%) | 268662 (22%) | |
Highest Education Level | No Diploma | 10269 | 77008 | 234764 |
Diploma or GED | 15413 | 91541 | 309720 | |
Some College | 15347 | 71302 | 195083 | |
Assoc. Degree | 5609 | 27155 | 81380 | |
Bachelors Degree | 88057 | 341210 | 668488 | |
Higher Degree | 72348 | 293853 | 561552 | |
Total Housing Units | 161,136 | 665,166 | 1,394,067 | |
--Owner-Occupied | 37,295 | 147,895 | 323,745 | |
--Renter-Occupied | 102,625 | 421,717 | 895,575 | |
Owner-Occupied Values | < 100K | 1471 | 4230 | 9566 |
100-199K | 1209 | 3380 | 9463 | |
200-299K | 851 | 3389 | 15688 | |
300-399K | 1033 | 6592 | 20986 | |
400-499K | 1865 | 8781 | 21778 | |
500K+ | 30866 | 121523 | 246264 | |
Total Working Age Population | 243,885 | 1,013,406 | 2,306,628 | |
In Work Force | 174,297 | 729,290 | 1,618,900 | |
Not In Work Force | 69,589 | 284,117 | 687,728 | |
Workforce Employed | 167,017 | 699,603 | 1,542,106 | |
Workforce Unemployed | 7,160 | 29,447 | 76,159 | |
Civlian Workforce | 174,177 | 729,050 | 1,618,265 | |
Military Workforce | 119 | 240 | 635 | |
Total Households | 139,920 | 569,612 | 1,219,320 | |
Family Households | 41,778 | 232,819 | 575,424 | |
Non-Family Households | 98,142 | 336,794 | 643,896 | |
Married Couple | 33,337 | 180,971 | 409,425 | |
Other Family | 8,440 | 51,848 | 165,999 | |
Married w/Child | 10,307 | 66,689 | 163,851 | |
Single Male w/Child | 806 | 4,328 | 14,234 | |
Single Female w/Child | 2,206 | 15,701 | 51,637 |
Population Change Last Two Decades - Plus Projection
2000 | % | 2010 | % | 2020 | % | 2030 | |
---|---|---|---|---|---|---|---|
New Jersey | 8,414,350 | +4 | 8,791,894 | +4 | 9,132,700 | +4 | 9,530,900 |
Bergen County | 884,118 | +2 | 905,116 | +7 | 967,500 | +7 | 1,031,500 |
Hudson County | 608,975 | +4 | 634,266 | +12 | 708,100 | +6 | 747,400 |
New York | 18,976,457 | +2 | 19,378,102 | +4 | 20,146,131 | +2 | 20,604,030 |
Bronx County | 1,332,650 | +4 | 1,385,108 | +10 | 1,519,809 | +6 | 1,604,168 |
Kings County | 2,465,326 | +2 | 2,504,700 | +9 | 2,738,283 | +5 | 2,863,996 |
New York County | 1,537,195 | +3 | 1,585,873 | +6 | 1,688,894 | +2 | 1,727,631 |
Queens County | 2,229,379 | 0 | 2,230,722 | +9 | 2,436,549 | +5 | 2,565,268 |
Total Working Age Population:
Total Households:
Total Working Age Population:
Total Households:
Total Working Age Population:
Total Households: