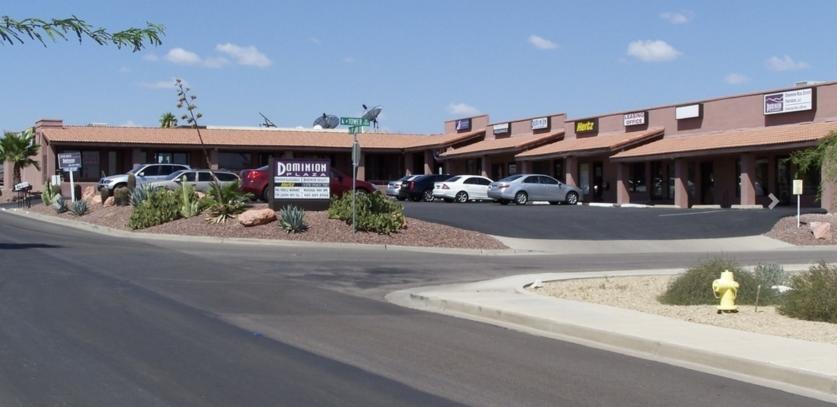
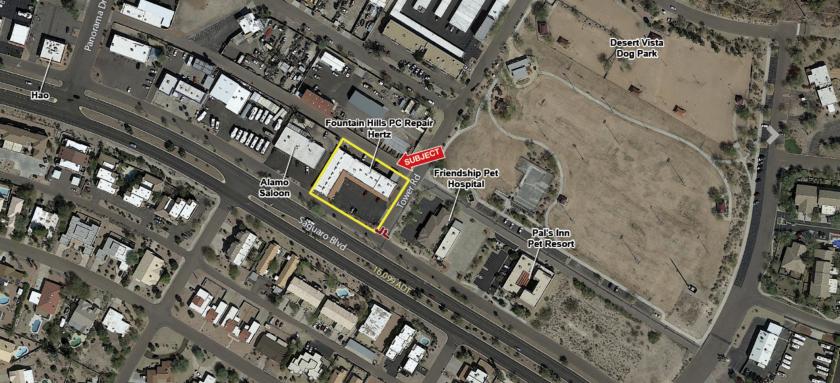
1-Mile | 3-Miles | 5-Miles | ||
---|---|---|---|---|
Total Population | 3,891 | 21,249 | 30,502 | |
Population Median Age | 57 | 53 | 52 | |
Population by Age | 0-9 Yrs | 120 (3%) | 1079 (5%) | 1446 (4%) |
10-19 Yrs | 302 (7%) | 1589 (7%) | 2610 (8%) | |
20-29 Yrs | 156 (4%) | 1055 (4%) | 1684 (5%) | |
30-39 Yrs | 197 (5%) | 1542 (7%) | 2103 (6%) | |
40-49 Yrs | 328 (8%) | 1992 (9%) | 2876 (9%) | |
50-59 Yrs | 629 (16%) | 3892 (18%) | 5885 (19%) | |
60-69 Yrs | 911 (23%) | 4855 (22%) | 6934 (22%) | |
70+ Yrs | 1248 (32%) | 5245 (24%) | 6964 (22%) | |
Median HH Income | $71,296 | $79,584 | $88,653 | |
Total Household Income | < 24K | 280 (13%) | 1222 (11%) | 1522 (10%) |
25-49K | 416 (19%) | 1763 (17%) | 2268 (16%) | |
50-74K | 421 (20%) | 1871 (18%) | 2278 (16%) | |
75-99K | 276 (13%) | 1364 (13%) | 1846 (13%) | |
100-199K | 525 (25%) | 2675 (26%) | 3830 (27%) | |
200K+ | 181 (8%) | 1317 (12%) | 2408 (17%) | |
Highest Education Level | No Diploma | 93 | 619 | 879 |
Diploma or GED | 498 | 2693 | 3594 | |
Some College | 809 | 4213 | 5693 | |
Assoc. Degree | 245 | 1978 | 2702 | |
Bachelors Degree | 1058 | 5298 | 7585 | |
Higher Degree | 745 | 3404 | 5293 | |
Total Housing Units | 2,737 | 12,401 | 16,968 | |
--Owner-Occupied | 1,489 | 7,798 | 11,433 | |
--Renter-Occupied | 609 | 2,414 | 2,719 | |
Owner-Occupied Values | < 100K | 15 | 153 | 228 |
100-199K | 208 | 908 | 962 | |
200-299K | 311 | 1344 | 1535 | |
300-399K | 311 | 1779 | 2276 | |
400-499K | 224 | 1276 | 1973 | |
500K+ | 419 | 2338 | 4458 | |
Total Working Age Population | 3,558 | 19,162 | 27,488 | |
In Work Force | 1,619 | 10,007 | 14,498 | |
Not In Work Force | 1,939 | 9,155 | 12,991 | |
Workforce Employed | 1,573 | 9,579 | 13,890 | |
Workforce Unemployed | 46 | 428 | 607 | |
Civlian Workforce | 1,619 | 10,007 | 14,498 | |
Military Workforce | 0 | 0 | 0 | |
Total Households | 2,098 | 10,212 | 14,152 | |
Family Households | 1,270 | 6,493 | 9,471 | |
Non-Family Households | 829 | 3,718 | 4,681 | |
Married Couple | 1,117 | 5,716 | 8,422 | |
Other Family | 152 | 777 | 1,049 | |
Married w/Child | 136 | 875 | 1,445 | |
Single Male w/Child | 61 | 198 | 249 | |
Single Female w/Child | 2 | 125 | 198 |
Population Change Last Two Decades - Plus Projection
2000 | % | 2010 | % | 2020 | % | 2030 | |
---|---|---|---|---|---|---|---|
Arizona | 5,130,632 | +25 | 6,392,017 | +14 | 7,286,100 | +14 | 8,284,900 |
Gila County | 51,335 | +4 | 53,597 | +3 | 55,100 | +1 | 55,400 |
Maricopa County | 3,072,149 | +24 | 3,817,117 | +16 | 4,436,900 | +15 | 5,107,700 |
Total Working Age Population:
Total Households:
Total Working Age Population:
Total Households:
Total Working Age Population:
Total Households: