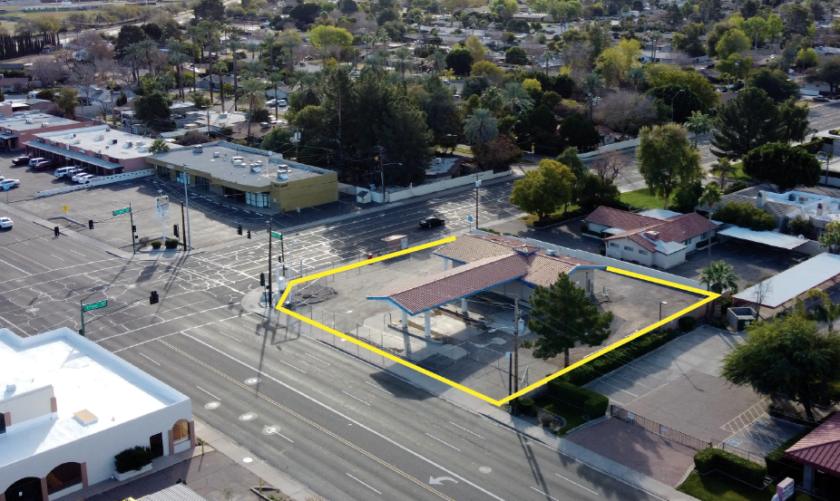
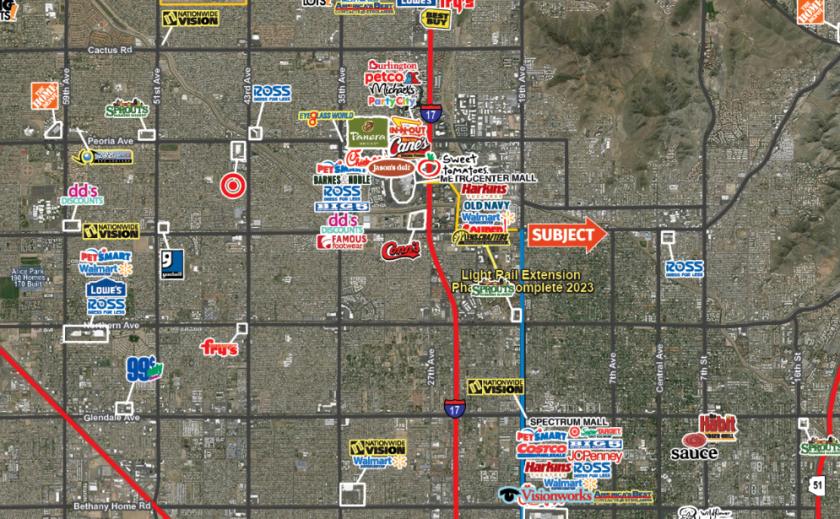
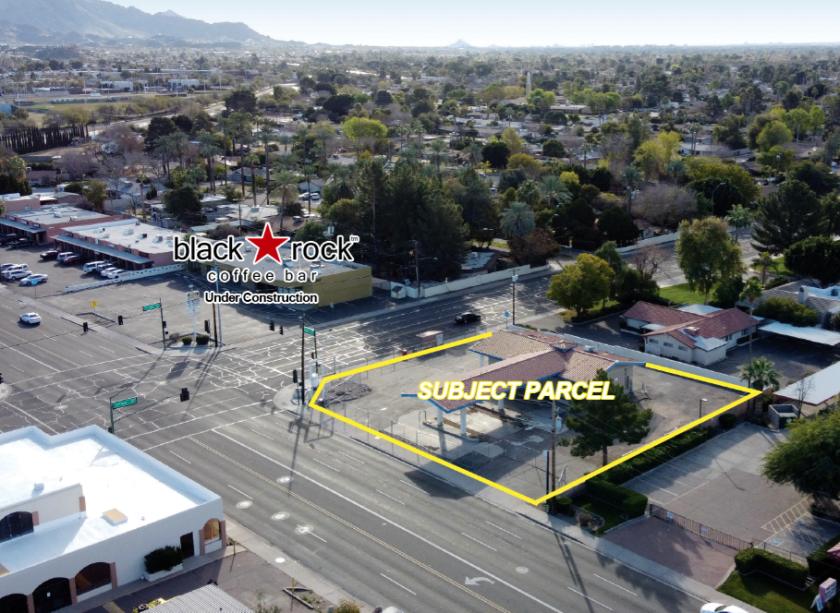
1-Mile | 3-Miles | 5-Miles | ||
---|---|---|---|---|
Total Population | 19,190 | 139,657 | 401,035 | |
Population Median Age | 36 | 37 | 37 | |
Population by Age | 0-9 Yrs | 2862 (14%) | 20145 (14%) | 55719 (13%) |
10-19 Yrs | 2696 (14%) | 16057 (11%) | 49238 (12%) | |
20-29 Yrs | 2605 (13%) | 21212 (15%) | 60645 (15%) | |
30-39 Yrs | 2817 (14%) | 19735 (14%) | 58144 (14%) | |
40-49 Yrs | 2369 (12%) | 18008 (12%) | 49788 (12%) | |
50-59 Yrs | 2440 (12%) | 16931 (12%) | 50046 (12%) | |
60-69 Yrs | 1671 (8%) | 14569 (10%) | 41208 (10%) | |
70+ Yrs | 1730 (9%) | 13000 (9%) | 36246 (9%) | |
Median HH Income | $49,387 | $46,876 | $52,060 | |
Total Household Income | < 24K | 1660 (25%) | 15228 (27%) | 35942 (23%) |
25-49K | 1693 (25%) | 14297 (25%) | 37774 (24%) | |
50-74K | 1168 (17%) | 9466 (16%) | 27797 (18%) | |
75-99K | 700 (10%) | 5500 (9%) | 17828 (11%) | |
100-199K | 935 (14%) | 8060 (14%) | 24769 (16%) | |
200K+ | 484 (7%) | 3264 (5%) | 8702 (5%) | |
Highest Education Level | No Diploma | 1893 | 13233 | 40439 |
Diploma or GED | 3576 | 23509 | 65065 | |
Some College | 2754 | 21760 | 63429 | |
Assoc. Degree | 740 | 7475 | 21907 | |
Bachelors Degree | 2112 | 16507 | 48016 | |
Higher Degree | 1396 | 11263 | 29065 | |
Total Housing Units | 7,407 | 62,442 | 168,472 | |
--Owner-Occupied | 3,126 | 24,455 | 78,117 | |
--Renter-Occupied | 3,514 | 31,359 | 74,694 | |
Owner-Occupied Values | < 100K | 310 | 3103 | 8418 |
100-199K | 712 | 6888 | 24981 | |
200-299K | 596 | 5286 | 20055 | |
300-399K | 467 | 3162 | 10340 | |
400-499K | 465 | 2197 | 5694 | |
500K+ | 576 | 3819 | 8630 | |
Total Working Age Population | 14,484 | 109,265 | 315,779 | |
In Work Force | 9,133 | 70,288 | 206,431 | |
Not In Work Force | 5,351 | 38,977 | 109,348 | |
Workforce Employed | 8,213 | 65,195 | 193,705 | |
Workforce Unemployed | 905 | 5,050 | 12,624 | |
Civlian Workforce | 9,118 | 70,245 | 206,329 | |
Military Workforce | 15 | 43 | 102 | |
Total Households | 6,640 | 55,814 | 152,812 | |
Family Households | 4,176 | 30,002 | 88,191 | |
Non-Family Households | 2,465 | 25,812 | 64,621 | |
Married Couple | 2,560 | 17,856 | 55,153 | |
Other Family | 1,616 | 12,146 | 33,037 | |
Married w/Child | 1,164 | 7,492 | 22,088 | |
Single Male w/Child | 206 | 1,709 | 4,902 | |
Single Female w/Child | 594 | 4,933 | 12,739 |
Population Change Last Two Decades - Plus Projection
2000 | % | 2010 | % | 2020 | % | 2030 | |
---|---|---|---|---|---|---|---|
Arizona | 5,130,632 | +25 | 6,392,017 | +14 | 7,286,100 | +14 | 8,284,900 |
Maricopa County | 3,072,149 | +24 | 3,817,117 | +16 | 4,436,900 | +15 | 5,107,700 |
Total Working Age Population:
Total Households:
Total Working Age Population:
Total Households:
Total Working Age Population:
Total Households: