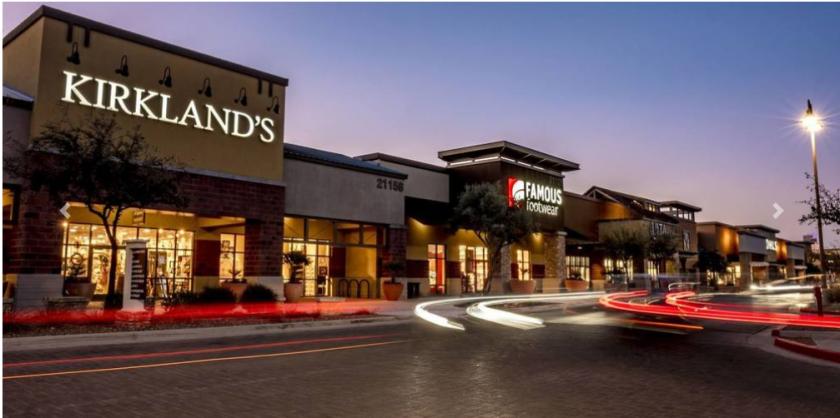
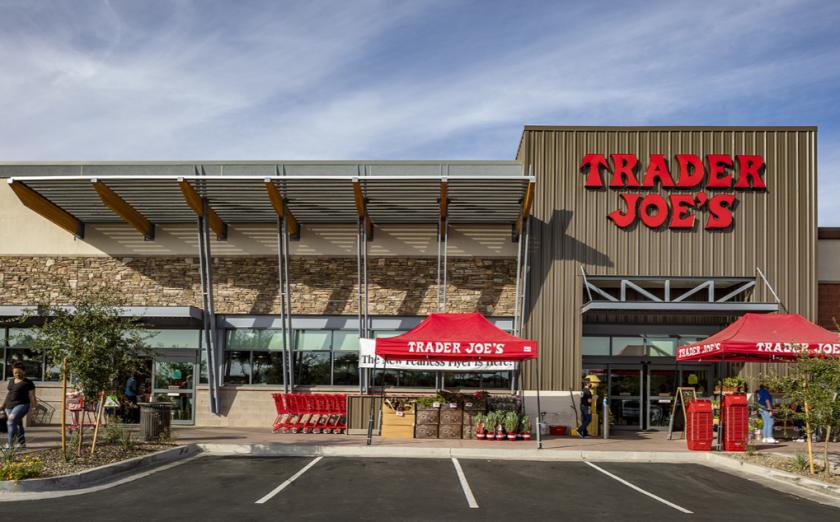
1-Mile | 3-Miles | 5-Miles | ||
---|---|---|---|---|
Total Population | 6,695 | 39,513 | 113,095 | |
Population Median Age | 33 | 35 | 34 | |
Population by Age | 0-9 Yrs | 1084 (16%) | 5979 (15%) | 18602 (16%) |
10-19 Yrs | 1141 (17%) | 7768 (19%) | 20936 (18%) | |
20-29 Yrs | 668 (9%) | 3122 (7%) | 10786 (9%) | |
30-39 Yrs | 1258 (18%) | 6029 (15%) | 17369 (15%) | |
40-49 Yrs | 923 (13%) | 6226 (15%) | 17100 (15%) | |
50-59 Yrs | 789 (11%) | 4206 (10%) | 11699 (10%) | |
60-69 Yrs | 509 (7%) | 3632 (9%) | 9688 (8%) | |
70+ Yrs | 323 (4%) | 2550 (6%) | 6916 (6%) | |
Median HH Income | $105,450 | $104,602 | $98,015 | |
Total Household Income | < 24K | 224 (10%) | 1094 (9%) | 2744 (7%) |
25-49K | 285 (13%) | 1608 (13%) | 4688 (13%) | |
50-74K | 216 (10%) | 1534 (12%) | 4913 (14%) | |
75-99K | 245 (11%) | 1514 (12%) | 5329 (15%) | |
100-199K | 813 (39%) | 4799 (39%) | 13082 (37%) | |
200K+ | 298 (14%) | 1573 (12%) | 3746 (10%) | |
Highest Education Level | No Diploma | 255 | 985 | 2815 |
Diploma or GED | 806 | 5194 | 14028 | |
Some College | 1176 | 6289 | 17777 | |
Assoc. Degree | 400 | 2135 | 7128 | |
Bachelors Degree | 926 | 6075 | 17586 | |
Higher Degree | 520 | 3372 | 8799 | |
Total Housing Units | 2,316 | 13,663 | 38,314 | |
--Owner-Occupied | 1,622 | 10,372 | 28,702 | |
--Renter-Occupied | 459 | 1,750 | 5,799 | |
Owner-Occupied Values | < 100K | 63 | 172 | 546 |
100-199K | 166 | 570 | 2827 | |
200-299K | 394 | 2833 | 8733 | |
300-399K | 362 | 2956 | 8120 | |
400-499K | 342 | 2055 | 4496 | |
500K+ | 294 | 1785 | 3981 | |
Total Working Age Population | 4,876 | 28,527 | 80,976 | |
In Work Force | 3,351 | 18,573 | 54,118 | |
Not In Work Force | 1,525 | 9,954 | 26,858 | |
Workforce Employed | 3,287 | 17,894 | 51,847 | |
Workforce Unemployed | 47 | 647 | 2,183 | |
Civlian Workforce | 3,334 | 18,541 | 54,030 | |
Military Workforce | 17 | 32 | 88 | |
Total Households | 2,081 | 12,121 | 34,501 | |
Family Households | 1,590 | 9,743 | 28,002 | |
Non-Family Households | 491 | 2,379 | 6,500 | |
Married Couple | 1,363 | 8,502 | 23,996 | |
Other Family | 227 | 1,241 | 4,005 | |
Married w/Child | 761 | 4,612 | 13,115 | |
Single Male w/Child | 38 | 292 | 913 | |
Single Female w/Child | 40 | 367 | 1,344 |
Population Change Last Two Decades - Plus Projection
2000 | % | 2010 | % | 2020 | % | 2030 | |
---|---|---|---|---|---|---|---|
Arizona | 5,130,632 | +25 | 6,392,017 | +14 | 7,286,100 | +14 | 8,284,900 |
Gila County | 51,335 | +4 | 53,597 | +3 | 55,100 | +1 | 55,400 |
Maricopa County | 3,072,149 | +24 | 3,817,117 | +16 | 4,436,900 | +15 | 5,107,700 |
Pinal County | 179,727 | +109 | 375,770 | +24 | 466,200 | +32 | 616,200 |
Total Working Age Population:
Total Households:
Total Working Age Population:
Total Households:
Total Working Age Population:
Total Households: