Retail Space
11274 South Fortuna Road Yuma, AZ 85367
11274 South Fortuna Road Yuma, AZ 85367

Details & Description
Property Highlights
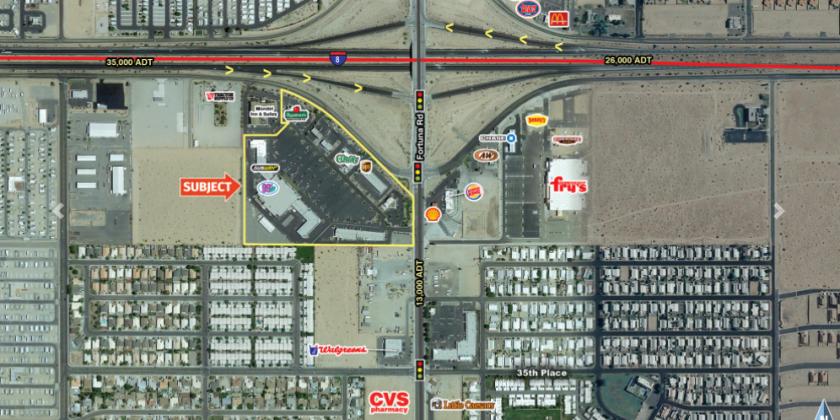
- • Neighborhood Center off I-8 at Fortuna Rd
- • Pad & Shop Space Available
- • Gas station PAD for sale
Additional Photos


Listing Agents

Jason Fessinger
O: 602-368-1090
jfessinger@w-retail.com
O: 602-368-1090
jfessinger@w-retail.com

Kalen Rickard
O: 602-931-4492
krickard@w-retail.com
O: 602-931-4492
krickard@w-retail.com

Julie Green
Western Retail Advisors
O: 602-710-1786
jgreen@w-retail.com
Western Retail Advisors
O: 602-710-1786
jgreen@w-retail.com
While we strive to provide the most accurate information, all listing information, and demographic data, is provided by third-parties. As such, MyEListing will not be responsible for the accuracy of the information. It is strongly recommended that you verify all information with the listing agent, and any relevant agencies, prior to making any decisions.


