Retail Space
2720 West Baseline Road Tempe, AZ 85283
2720 West Baseline Road Tempe, AZ 85283

Details & Description
Property Highlights
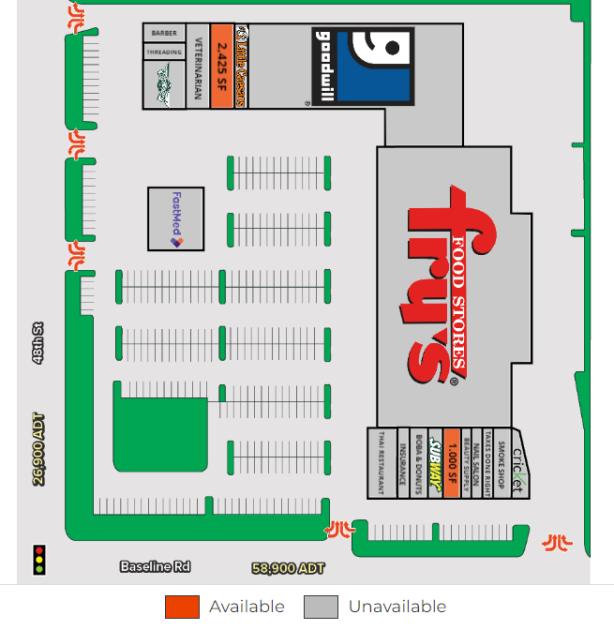
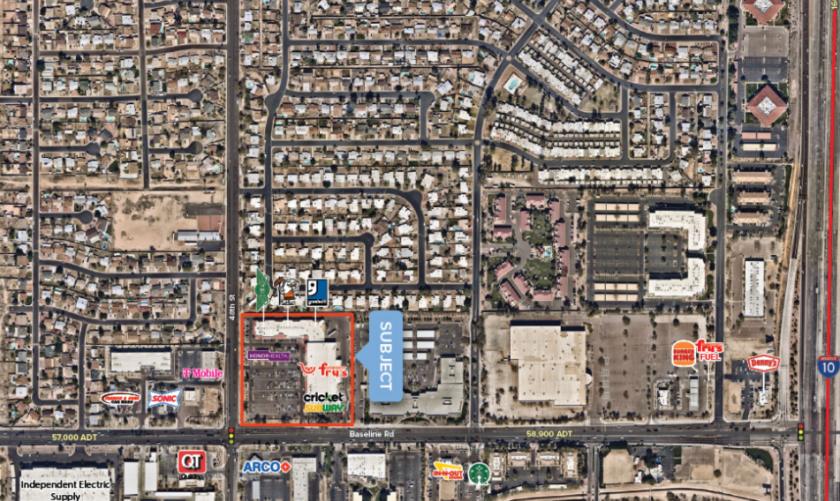
- • Neighborhood Center off the I-10 at Baseline Rd
- • Ample parking
- • Pylon signage available
- • Close proximity to I-10 and US-60 for easy access
Additional Photos

Listing Agents

Jason Fessinger
O: 602-368-1090
jfessinger@w-retail.com
O: 602-368-1090
jfessinger@w-retail.com

Kalen Rickard
O: 602-931-4492
krickard@w-retail.com
O: 602-931-4492
krickard@w-retail.com

Julie Green
Western Retail Advisors
O: 602-710-1786
jgreen@w-retail.com
Western Retail Advisors
O: 602-710-1786
jgreen@w-retail.com
While we strive to provide the most accurate information, all listing information, and demographic data, is provided by third-parties. As such, MyEListing will not be responsible for the accuracy of the information. It is strongly recommended that you verify all information with the listing agent, and any relevant agencies, prior to making any decisions.


