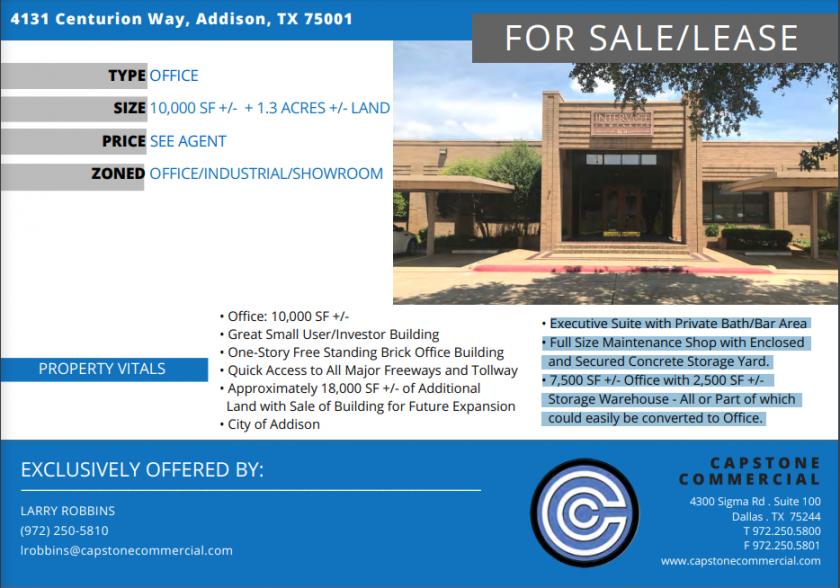
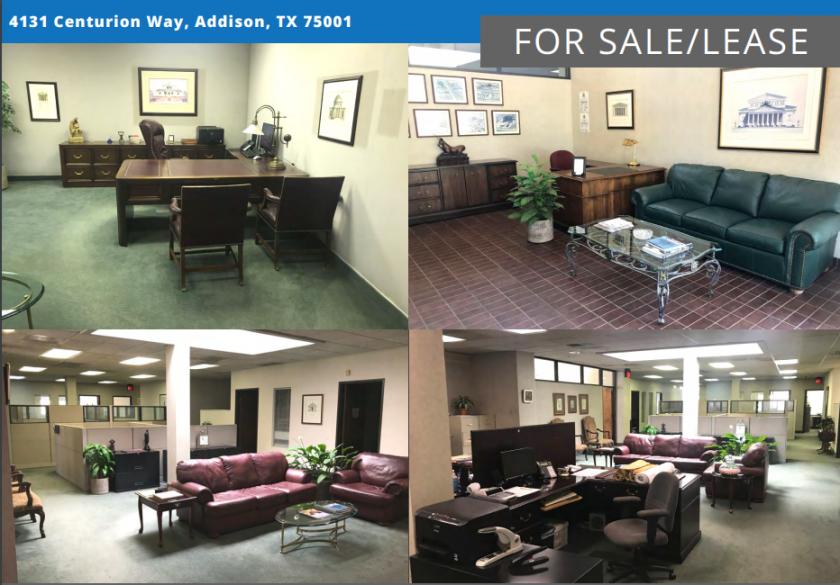
Office: 10,000 SF +/-
• Great Small User/Investor Building
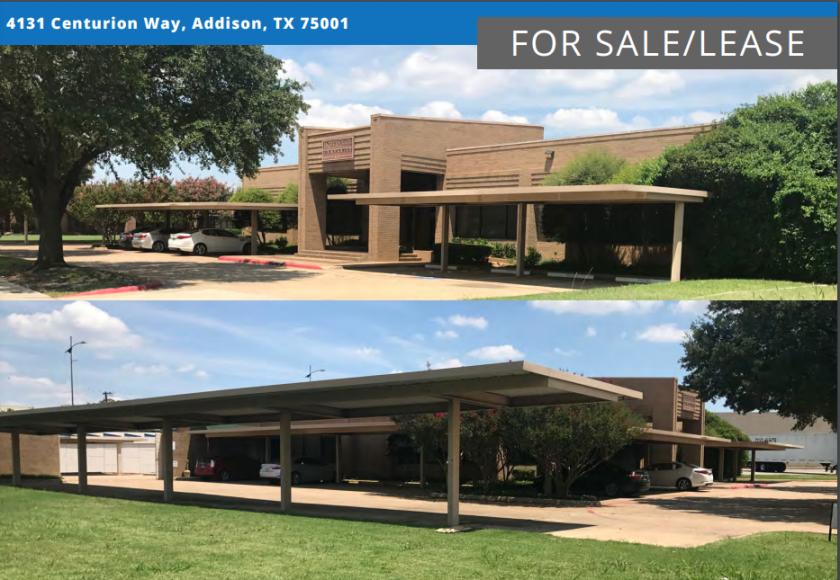
• One-Story Free Standing Brick Office Building
• Quick Access to All Major Freeways and Tollway
• Approximately 18,000 SF +/- of Additional
Land with Sale of Building for Future Expansion
• City of Addison
Executive Suite with Private Bath/Bar Area
• Full Size Maintenance Shop with Enclosed
and Secured Concrete Storage Yard.
• 7,500 SF +/- Office with 2,500 SF +/-
Storage Warehouse - All or Part of which
could easily be converted to Office.
No part of this information may be copied, reproduced, repurposed, or screen-captured for any commercial purpose without prior written authorization from MyEListing.
While we strive to provide the most accurate information, all listing information, and demographic data, is provided by third-parties. As such, MyEListing will not be responsible for the accuracy of the information. It is strongly recommended that you verify all information with the listing agent, and any relevant agencies, prior to making any decisions.
What is the building size of this Office property in Addison, TX?
The size of the building/unit at 4131 Centurion Way in Addison is 10,000 square feet
How much land does the Addison, TX property at 4131 Centurion Way include?
4131 Centurion Way in Addison includes 1.300 acres of land
What kind of Office is the propery at 4131 Centurion Way?
The property at 4131 Centurion Way Addison, TX 75001 is listed as a Professional Office property
What is the population within 1 mile of 4131 Centurion Way in Addison?
The population within 1 mile of 4131 Centurion Way Addison, TX 75001 is 10,510 people.
Who do I contact for questions about 4131 Centurion Way?
You should contact the listing agent,
Larry Robbins, for any details regarding this commercial listing.