Commercial Land
7910 West Beardsley Road Glendale, AZ 85308
7910 West Beardsley Road Glendale, AZ 85308
Details & Description
Property Highlights
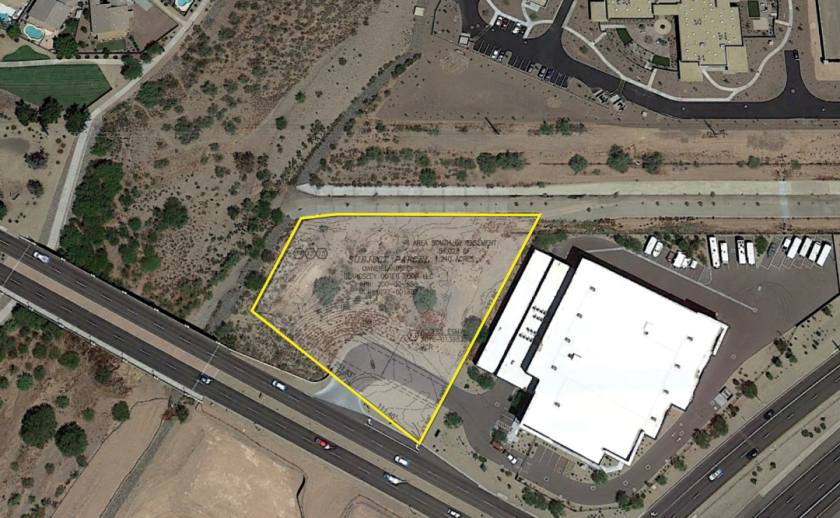
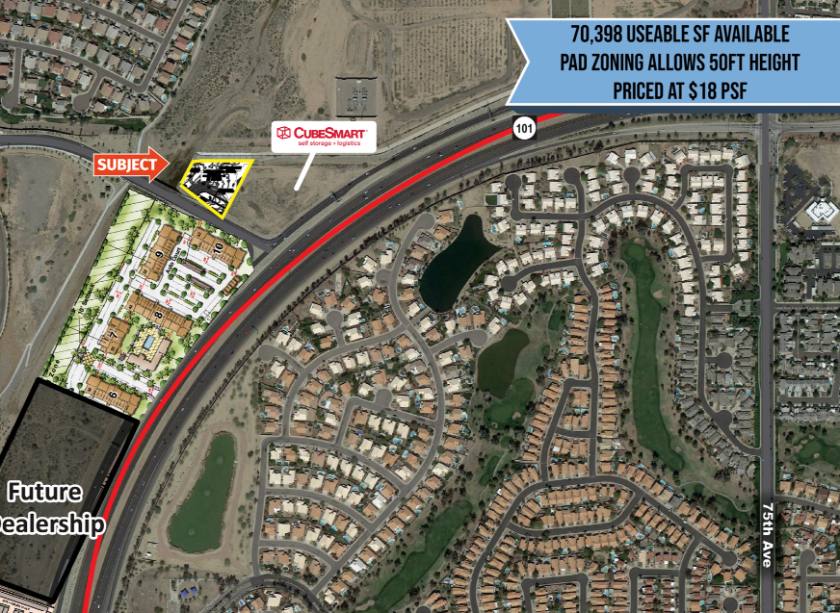
- • Land Available for Development off the Loop 101
- • 70,398 useable SF located directly off Loop 101
- • 325 Apartments Building to the south
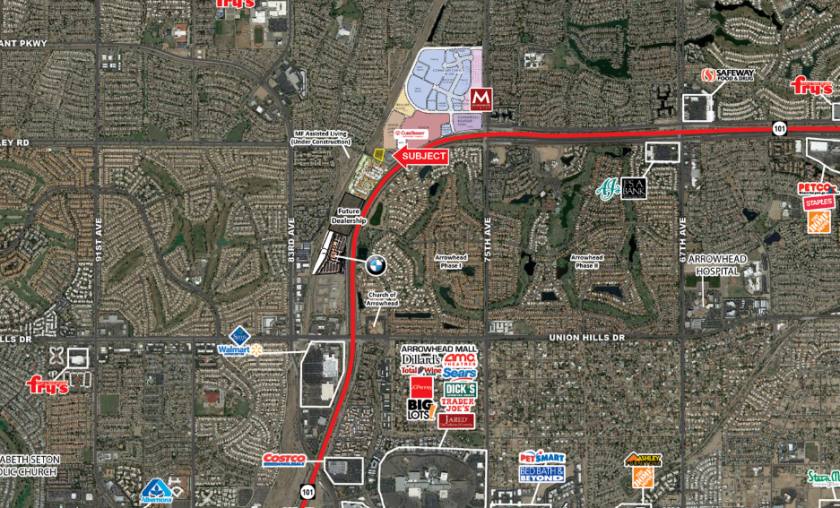
- • Banner Health to the East
- • 2 Miles from Arrowhead Town Center
Listing Agents

Brian Gausden
O: 602-778-3740
bgausden@w-retail.com
O: 602-778-3740
bgausden@w-retail.com
While we strive to provide the most accurate information, all listing information, and demographic data, is provided by third-parties. As such, MyEListing will not be responsible for the accuracy of the information. It is strongly recommended that you verify all information with the listing agent, and any relevant agencies, prior to making any decisions.