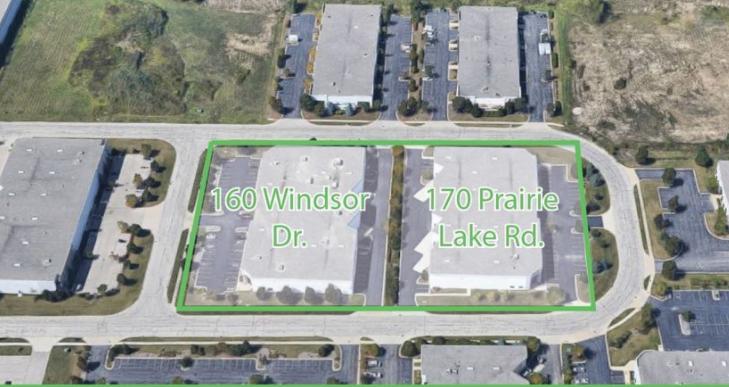
High image precast construction available for lease in East Dundee. Two properties in portfolio, 160 Windsor and 170 Prairie Lake. Max. SF of 59,600.
Highlights
Suites A & B can be combined for a total of 40,700 SF and office space of 6,320 SF
New institutional ownership
Outstanding manufacturing facility
Heavy power
Abundant labor pool
Temperature Controlled Machine/EDM Room
2,200 SF mezzanine not included in overall SF
Can be combined with 170 Prairie Lake for a max SF of 59,600 SF
No part of this information may be copied, reproduced, repurposed, or screen-captured for any commercial purpose without prior written authorization from MyEListing.
While we strive to provide the most accurate information, all listing information, and demographic data, is provided by third-parties. As such, MyEListing will not be responsible for the accuracy of the information. It is strongly recommended that you verify all information with the listing agent, and any relevant agencies, prior to making any decisions.
What is the building size of this commercial Industrial property?
The size of this multi-unit property varies between 18900 - 59600 square feet
What kind of Industrial is the propery at 170 Prairie Lakes Road?
The property at 170 Prairie Lakes Road East Dundee, IL 60118 is listed as a Other Industrial Industrial property
What is the population within 1 mile of 170 Prairie Lakes Road in East Dundee?
The population within 1 mile of 170 Prairie Lakes Road East Dundee, IL 60118 is 9,586 people.
Who do I contact for questions about 170 Prairie Lakes Road?
You should contact the listing agent,
Daniel Cawley, for any details regarding this commercial listing.