Industrial Properties
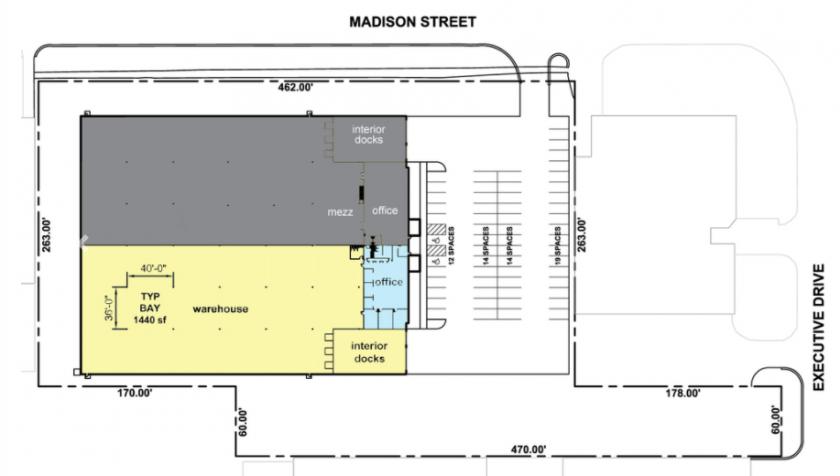
7630 South Madison Street Willowbrook, IL 60527
7630 South Madison Street Willowbrook, IL 60527

Details & Description
Listing Agents

Daniel Cawley
O: 630-810-1855
dcawley@cawleychicago.com
O: 630-810-1855
dcawley@cawleychicago.com
While we strive to provide the most accurate information, all listing information, and demographic data, is provided by third-parties. As such, MyEListing will not be responsible for the accuracy of the information. It is strongly recommended that you verify all information with the listing agent, and any relevant agencies, prior to making any decisions.