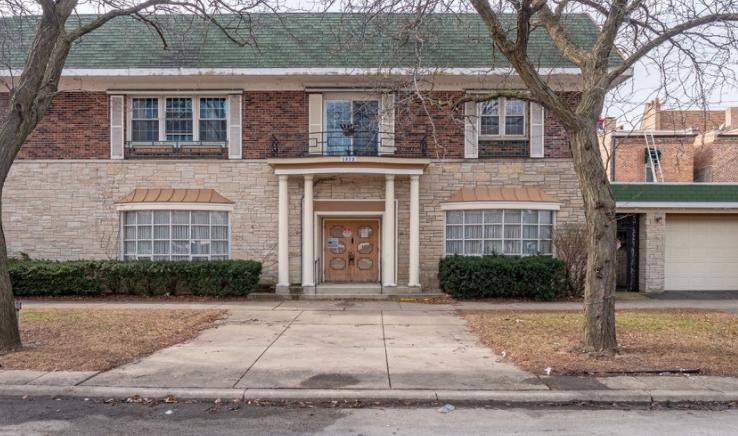
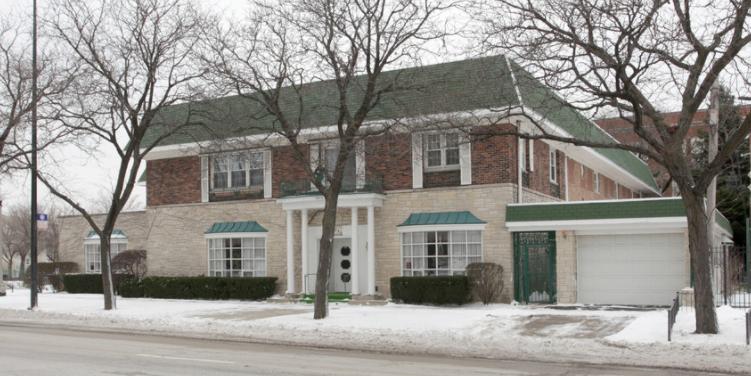
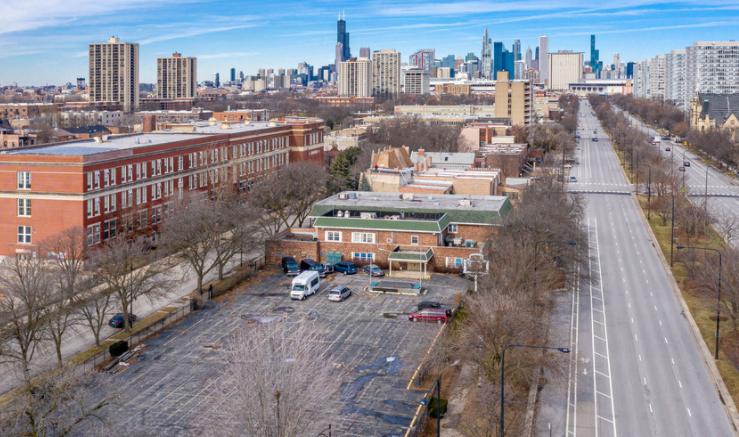
1-Mile | 3-Miles | 5-Miles | ||
---|---|---|---|---|
Total Population | 33,856 | 260,161 | 733,265 | |
Population Median Age | 38 | 37 | 37 | |
Population by Age | 0-9 Yrs | 3287 (9%) | 26023 (10%) | 75244 (10%) |
10-19 Yrs | 4115 (12%) | 26934 (10%) | 75120 (10%) | |
20-29 Yrs | 7538 (22%) | 54578 (20%) | 156953 (21%) | |
30-39 Yrs | 4971 (14%) | 46034 (17%) | 134012 (18%) | |
40-49 Yrs | 3516 (10%) | 31270 (12%) | 83809 (11%) | |
50-59 Yrs | 3399 (10%) | 28544 (10%) | 78981 (10%) | |
60-69 Yrs | 3693 (10%) | 25878 (9%) | 72432 (9%) | |
70+ Yrs | 3338 (9%) | 20900 (8%) | 56714 (7%) | |
Median HH Income | $33,793 | $56,079 | $62,464 | |
Total Household Income | < 24K | 6565 (41%) | 34947 (29%) | 86811 (26%) |
25-49K | 3052 (19%) | 20567 (17%) | 54641 (16%) | |
50-74K | 2175 (13%) | 16825 (14%) | 43207 (13%) | |
75-99K | 1562 (9%) | 12907 (10%) | 33443 (10%) | |
100-199K | 1791 (11%) | 24277 (20%) | 69503 (21%) | |
200K+ | 498 (3%) | 9529 (8%) | 40242 (12%) | |
Highest Education Level | No Diploma | 3003 | 23795 | 72773 |
Diploma or GED | 4389 | 32157 | 94905 | |
Some College | 4473 | 27623 | 71491 | |
Assoc. Degree | 1499 | 9874 | 22026 | |
Bachelors Degree | 4999 | 44862 | 129744 | |
Higher Degree | 4563 | 45603 | 127433 | |
Total Housing Units | 17,392 | 133,370 | 383,320 | |
--Owner-Occupied | 3,106 | 40,760 | 116,766 | |
--Renter-Occupied | 12,537 | 78,291 | 211,080 | |
Owner-Occupied Values | < 100K | 250 | 2591 | 9128 |
100-199K | 779 | 7233 | 22485 | |
200-299K | 819 | 9752 | 23106 | |
300-399K | 609 | 8775 | 18397 | |
400-499K | 281 | 5153 | 13671 | |
500K+ | 368 | 7256 | 29981 | |
Total Working Age Population | 28,441 | 220,057 | 618,418 | |
In Work Force | 16,440 | 145,313 | 406,385 | |
Not In Work Force | 12,001 | 74,744 | 212,033 | |
Workforce Employed | 14,552 | 133,309 | 372,924 | |
Workforce Unemployed | 1,886 | 11,708 | 32,988 | |
Civlian Workforce | 16,438 | 145,017 | 405,912 | |
Military Workforce | 3 | 297 | 473 | |
Total Households | 15,642 | 119,051 | 327,846 | |
Family Households | 6,185 | 52,693 | 145,946 | |
Non-Family Households | 9,457 | 66,358 | 181,900 | |
Married Couple | 2,748 | 30,952 | 90,263 | |
Other Family | 3,438 | 21,741 | 55,684 | |
Married w/Child | 981 | 11,526 | 30,653 | |
Single Male w/Child | 188 | 1,608 | 4,839 | |
Single Female w/Child | 1,600 | 8,205 | 21,800 |
Population Change Last Two Decades - Plus Projection
2000 | % | 2010 | % | 2020 | % | 2030 | |
---|---|---|---|---|---|---|---|
Illinois | 12,419,293 | +3 | 12,830,632 | +12 | 14,316,487 | +6 | 15,138,849 |
Cook County | 5,376,741 | -3 | 5,194,675 | +10 | 5,707,832 | +5 | 5,990,243 |
Total Working Age Population:
Total Households:
Total Working Age Population:
Total Households:
Total Working Age Population:
Total Households: