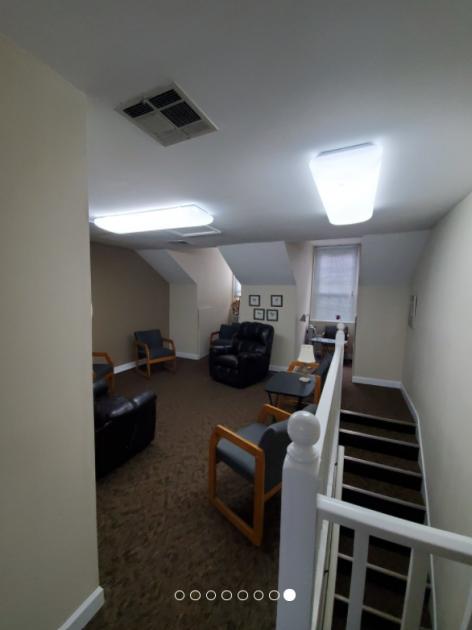
Office Space
3939 Houma Boulevard, 3A Metairie, LA 70006
3939 Houma Boulevard, 3A Metairie, LA 70006
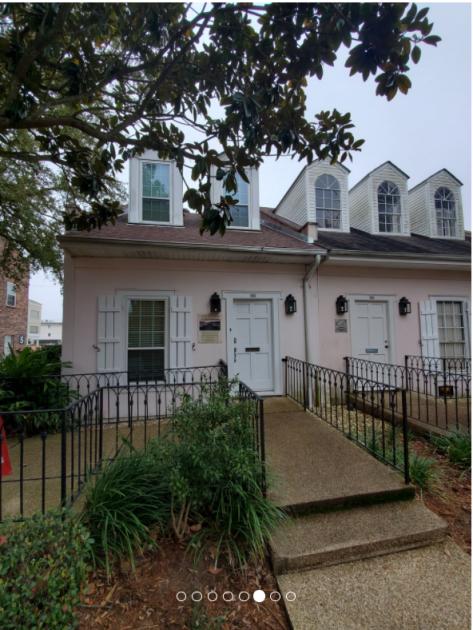
Details & Description
Listing Agents

Collin Holmes
O: 504-620-0356
cholmes@srsa-realestate.com
O: 504-620-0356
cholmes@srsa-realestate.com

SRSA Commercial
SRSA Commercial Real Estate
O: 504-831-2363
ETanner@SRSA-RealEstate.com
SRSA Commercial Real Estate
O: 504-831-2363
ETanner@SRSA-RealEstate.com
While we strive to provide the most accurate information, all listing information, and demographic data, is provided by third-parties. As such, MyEListing will not be responsible for the accuracy of the information. It is strongly recommended that you verify all information with the listing agent, and any relevant agencies, prior to making any decisions.