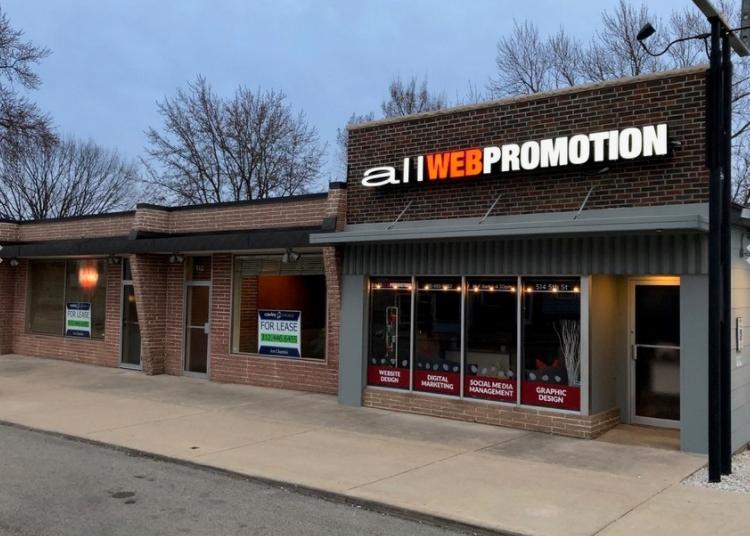
High visibility restaurant and retail space available for lease in Peru, Illinois.
Highlights
Perfect Bar, Pizza by the slice, ice-cream shop, pop up restaurant.
High Visibility on US Route 6 with traffic count over 9400 vehicles daily
Located just steps from Westclox in Peru’s historic East end.
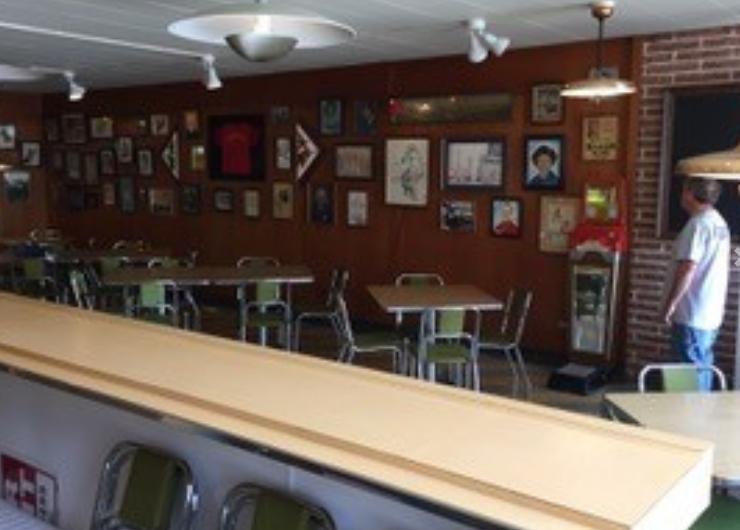
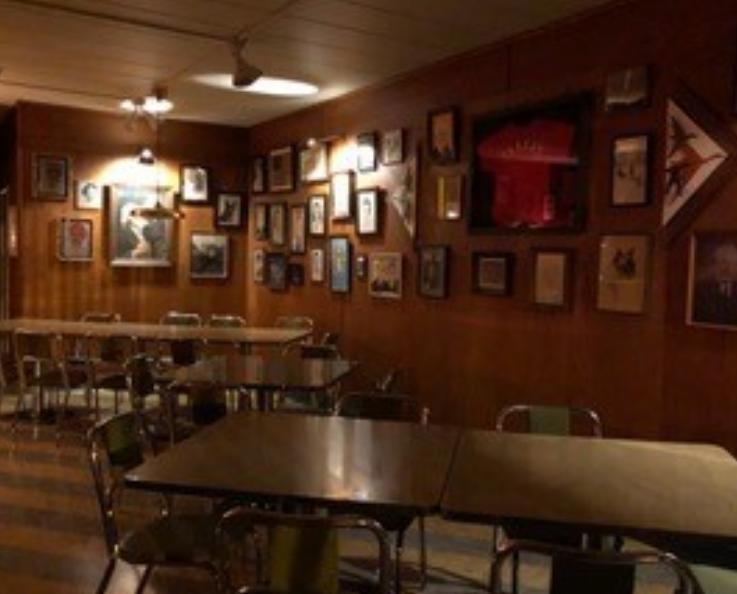
Great Vintage/ Retro styling.
Pylon signage available
Fresh Restoration includes:
(2) new restrooms; Bar with 3 compartment sink; New lighting;
Chairs, table and barstools for 46; Kitchen equipment;
2 televisions and stereo; Large fenced concrete patio; Warm dry
basement; Dumbwaiter; Washer dryer; Decor is negotiable;
High efficiency HVAC; New roof
Perfect retail, studio, food & beverage or office space
Great vintage/Retro styling retail space
Fresh Renovation includes:
Two (2) new restrooms
Bar with 3 compartment sinks and dedicated 30 amp outlets
New lighting and floors
Open studio floor plan
No part of this information may be copied, reproduced, repurposed, or screen-captured for any commercial purpose without prior written authorization from MyEListing.
While we strive to provide the most accurate information, all listing information, and demographic data, is provided by third-parties. As such, MyEListing will not be responsible for the accuracy of the information. It is strongly recommended that you verify all information with the listing agent, and any relevant agencies, prior to making any decisions.
What is the building size of this Retail property in Peru, IL?
The size of the building/unit at 510 5th Street in Peru is 6,250 square feet
What kind of Retail is the propery at 510 5th Street?
The property at 510 5th Street Peru, IL 61354 is listed as a Other Retail Retail property
What is the population within 1 mile of 510 5th Street in Peru?
The population within 1 mile of 510 5th Street Peru, IL 61354 is 6,282 people.
Who do I contact for questions about 510 5th Street?
You should contact the listing agent,
Jon Chamlin, for any details regarding this commercial listing.