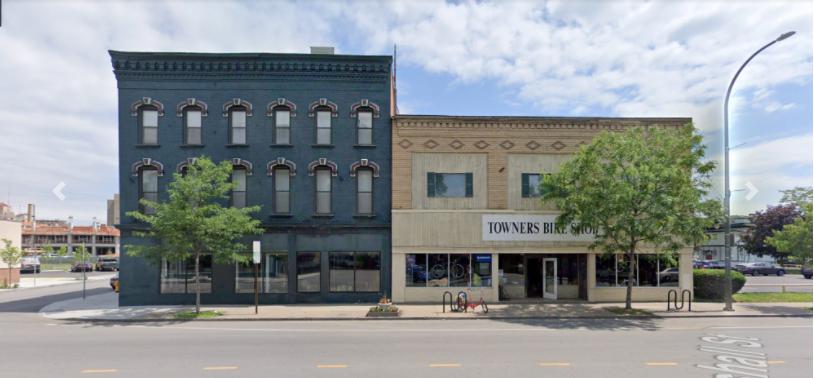
Two buildings with NNN and Gross lease spaces available.
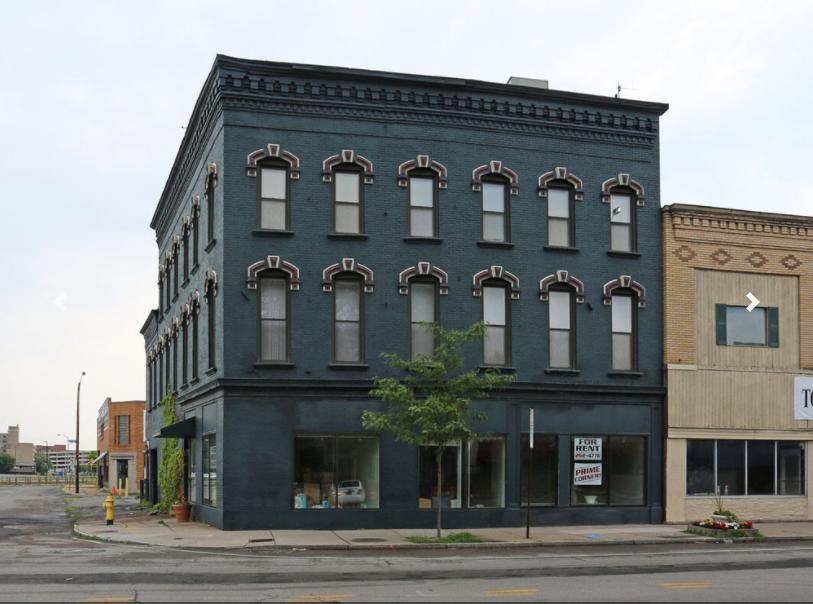
182-186 Monroe Ave has up to 2,500 SF of street-level retail space with an additional 1,400 SF of available office space above it. The ground floor space has large windows that bring in tons of natural light and help to attract customers. The two spaces have access to each other via a staircase and can be combined for tenants looking to have a street-level sales floor with office space above it. The spaces have forced air heat, A/C, and electrical power. All utilities are included in the lease, but may be separated out based on use.
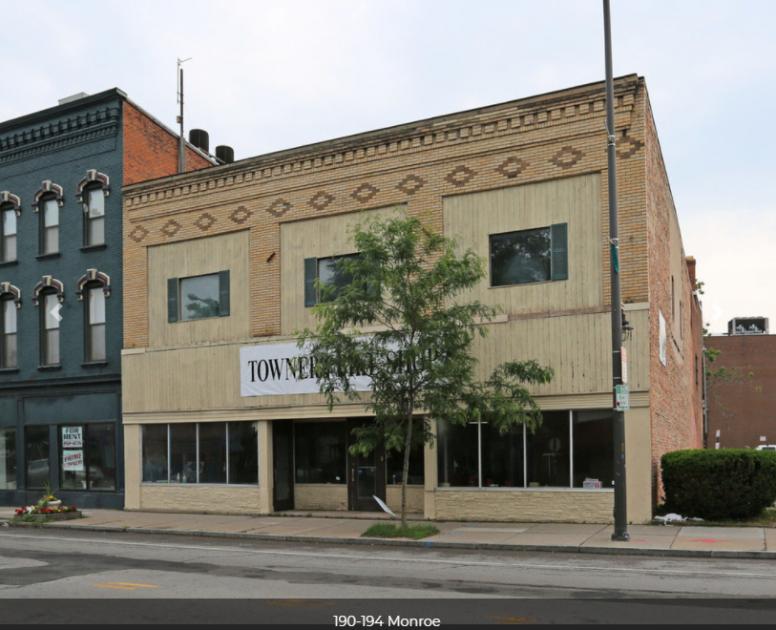
190-194 Monroe Ave is a two-story 10,800 SF building with 5,400 SF available on each floor. Both floors can be leased together, or separated out into two distinct units depending on tenant needs and financials. Ideal use for the space would be a brewery, distillery, or cider mill with a tasting room and retail space on the first floor and using the second floor as an event space.
Highlights
Located in an Opportunity Zone
Properties under new ownership
Located in walkable neighborhood
Only a few hundred feet from the Strong Museum of Play
No part of this information may be copied, reproduced, repurposed, or screen-captured for any commercial purpose without prior written authorization from MyEListing.
While we strive to provide the most accurate information, all listing information, and demographic data, is provided by third-parties. As such, MyEListing will not be responsible for the accuracy of the information. It is strongly recommended that you verify all information with the listing agent, and any relevant agencies, prior to making any decisions.
What is the asking price for 1 Manhattan Square Drive in Rochester?
The asking price for 1 Manhattan Square Drive is $12.50 a SF per Year
What is the building size of this commercial Retail property?
The size of this multi-unit property varies between 1400 - 5400 square feet
What kind of Retail is the propery at 1 Manhattan Square Drive?
The property at 1 Manhattan Square Drive Rochester, NY 14607 is listed as a Shopping Center Retail property
What is the population within 1 mile of 1 Manhattan Square Drive in Rochester?
The population within 1 mile of 1 Manhattan Square Drive Rochester, NY 14607 is 27,194 people.
Who do I contact for questions about 1 Manhattan Square Drive?
You should contact the listing agent,
Brian Donovan, for any details regarding this commercial listing.