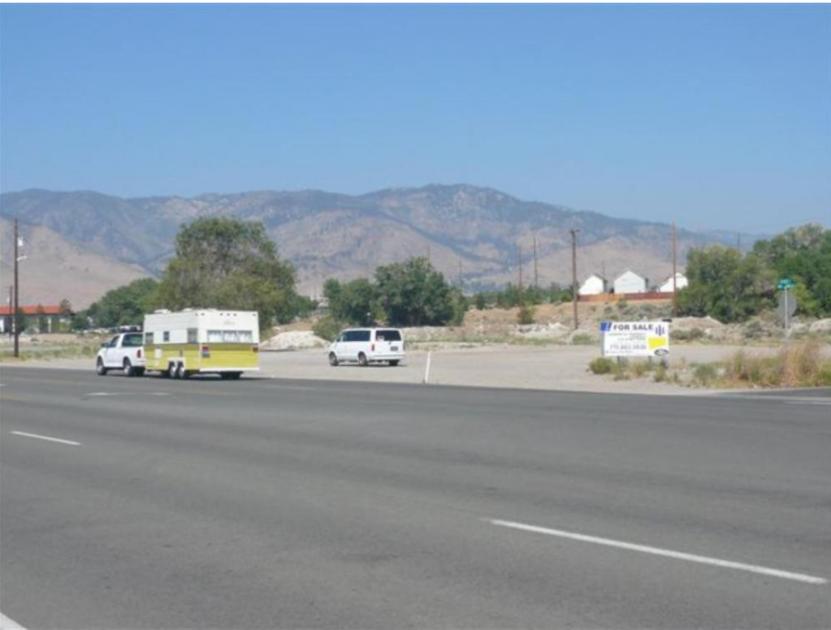
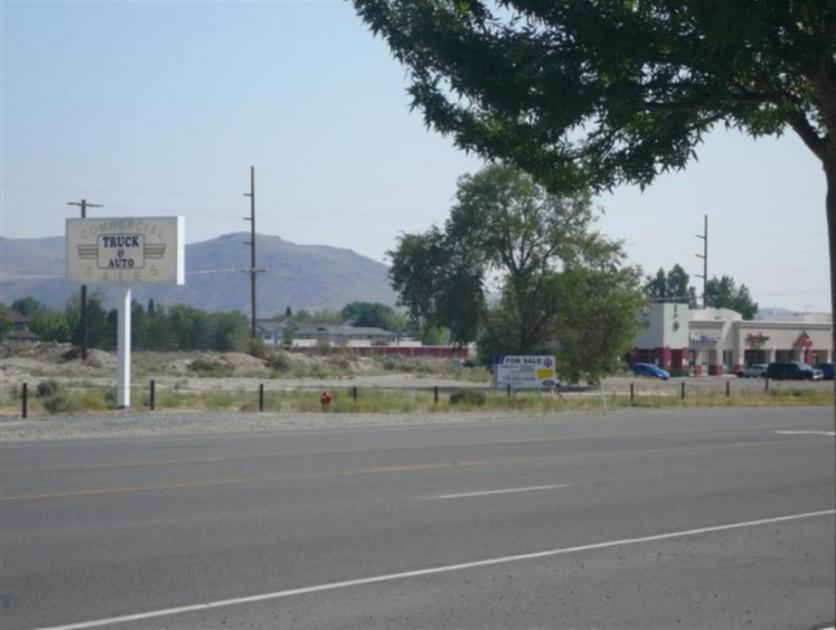
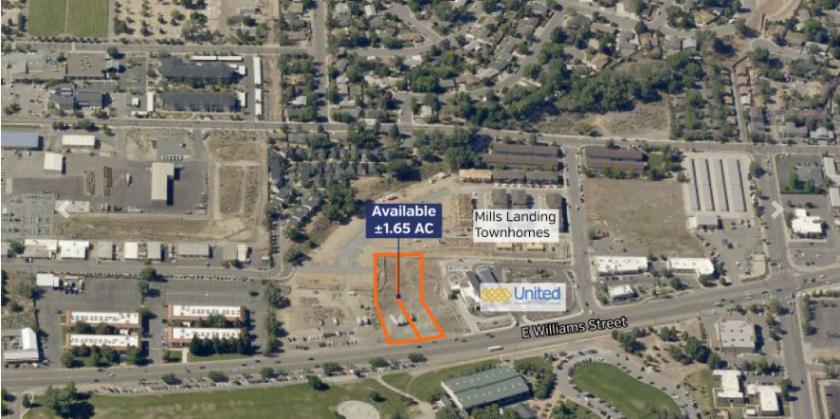
1-Mile | 3-Miles | 5-Miles | ||
---|---|---|---|---|
Total Population | 12,089 | 47,164 | 53,921 | |
Population Median Age | 38 | 41 | 41 | |
Population by Age | 0-9 Yrs | 1611 (13%) | 5788 (12%) | 6178 (11%) |
10-19 Yrs | 1554 (12%) | 5444 (11%) | 6087 (11%) | |
20-29 Yrs | 1817 (15%) | 6139 (13%) | 6685 (12%) | |
30-39 Yrs | 1469 (12%) | 6118 (12%) | 6775 (12%) | |
40-49 Yrs | 1452 (12%) | 5281 (11%) | 6211 (11%) | |
50-59 Yrs | 1514 (12%) | 6283 (13%) | 7554 (14%) | |
60-69 Yrs | 1344 (11%) | 6032 (12%) | 7195 (13%) | |
70+ Yrs | 1329 (10%) | 6079 (12%) | 7236 (13%) | |
Median HH Income | $47,900 | $53,378 | $55,488 | |
Total Household Income | < 24K | 1289 (24%) | 4217 (21%) | 4474 (19%) |
25-49K | 1425 (27%) | 5056 (25%) | 5467 (24%) | |
50-74K | 1081 (20%) | 4186 (20%) | 4534 (20%) | |
75-99K | 528 (10%) | 2582 (12%) | 3069 (13%) | |
100-199K | 806 (15%) | 3316 (16%) | 3988 (17%) | |
200K+ | 67 (1%) | 669 (3%) | 900 (4%) | |
Highest Education Level | No Diploma | 1068 | 4529 | 5092 |
Diploma or GED | 2185 | 8793 | 10032 | |
Some College | 2716 | 9700 | 11235 | |
Assoc. Degree | 696 | 3212 | 3849 | |
Bachelors Degree | 872 | 4499 | 5443 | |
Higher Degree | 435 | 2285 | 2890 | |
Total Housing Units | 5,526 | 21,114 | 23,597 | |
--Owner-Occupied | 2,105 | 10,516 | 12,523 | |
--Renter-Occupied | 3,091 | 9,511 | 9,910 | |
Owner-Occupied Values | < 100K | 393 | 1714 | 1852 |
100-199K | 398 | 1729 | 1820 | |
200-299K | 760 | 3417 | 3668 | |
300-399K | 436 | 2107 | 2682 | |
400-499K | 92 | 900 | 1224 | |
500K+ | 27 | 649 | 1277 | |
Total Working Age Population | 9,652 | 38,105 | 44,112 | |
In Work Force | 6,120 | 23,818 | 26,875 | |
Not In Work Force | 3,532 | 14,287 | 17,237 | |
Workforce Employed | 5,806 | 22,605 | 25,496 | |
Workforce Unemployed | 311 | 1,201 | 1,368 | |
Civlian Workforce | 6,117 | 23,806 | 26,863 | |
Military Workforce | 3 | 12 | 12 | |
Total Households | 5,196 | 20,027 | 22,432 | |
Family Households | 2,776 | 12,097 | 13,892 | |
Non-Family Households | 2,421 | 7,930 | 8,541 | |
Married Couple | 1,799 | 8,222 | 9,703 | |
Other Family | 977 | 3,876 | 4,189 | |
Married w/Child | 760 | 3,126 | 3,487 | |
Single Male w/Child | 218 | 754 | 797 | |
Single Female w/Child | 366 | 1,279 | 1,368 |
Population Change Last Two Decades - Plus Projection
2000 | % | 2010 | % | 2020 | % | 2030 | |
---|---|---|---|---|---|---|---|
Nevada | 1,998,257 | +35 | 2,700,551 | +17 | 3,149,234 | +10 | 3,460,728 |
Douglas County | 41,259 | +14 | 46,997 | +6 | 49,695 | +2 | 50,673 |
Lyon County | 34,501 | +51 | 51,980 | +12 | 57,987 | +13 | 65,788 |
Washoe County | 339,486 | +24 | 421,407 | +14 | 479,336 | +13 | 542,877 |
Carson City | 52,457 | +5 | 55,274 | +2 | 56,546 | +2 | 57,790 |
Total Working Age Population:
Total Households:
Total Working Age Population:
Total Households:
Total Working Age Population:
Total Households: