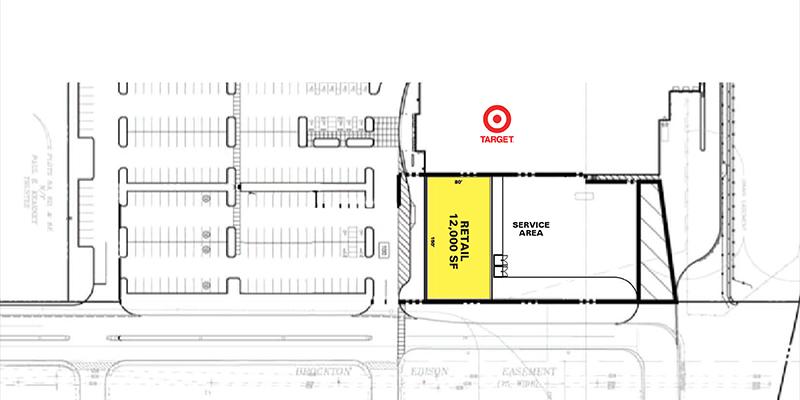
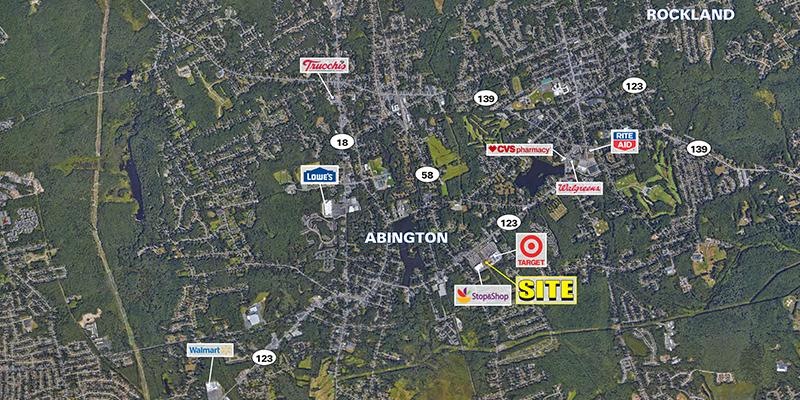
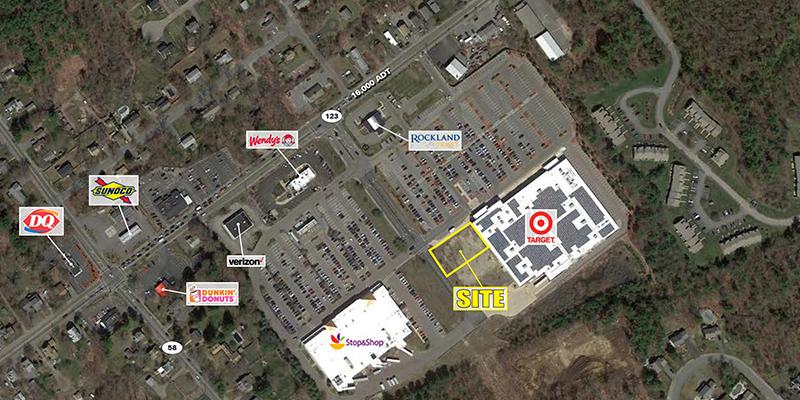
1-Mile | 3-Miles | 5-Miles | ||
---|---|---|---|---|
Total Population | 6,666 | 51,053 | 128,280 | |
Population Median Age | 38 | 39 | 40 | |
Population by Age | 0-9 Yrs | 941 (14%) | 5799 (11%) | 14628 (11%) |
10-19 Yrs | 681 (10%) | 6516 (12%) | 16391 (12%) | |
20-29 Yrs | 804 (12%) | 6730 (13%) | 16021 (12%) | |
30-39 Yrs | 1114 (16%) | 6649 (13%) | 16624 (12%) | |
40-49 Yrs | 917 (13%) | 7230 (14%) | 17418 (13%) | |
50-59 Yrs | 843 (12%) | 7542 (14%) | 19060 (14%) | |
60-69 Yrs | 844 (12%) | 5666 (11%) | 14703 (11%) | |
70+ Yrs | 522 (7%) | 4922 (9%) | 13436 (10%) | |
Median HH Income | $103,857 | $91,398 | $88,271 | |
Total Household Income | < 24K | 303 (12%) | 2360 (12%) | 6121 (13%) |
25-49K | 305 (12%) | 2726 (14%) | 6763 (14%) | |
50-74K | 254 (10%) | 2946 (15%) | 7454 (15%) | |
75-99K | 327 (13%) | 2206 (11%) | 5663 (12%) | |
100-199K | 1088 (44%) | 6873 (36%) | 15852 (33%) | |
200K+ | 192 (7%) | 1848 (9%) | 4836 (10%) | |
Highest Education Level | No Diploma | 280 | 1915 | 6661 |
Diploma or GED | 1438 | 10462 | 26758 | |
Some College | 956 | 7124 | 17682 | |
Assoc. Degree | 297 | 3441 | 8696 | |
Bachelors Degree | 1311 | 8902 | 20136 | |
Higher Degree | 425 | 3582 | 9469 | |
Total Housing Units | 2,599 | 20,052 | 48,775 | |
--Owner-Occupied | 1,785 | 14,060 | 35,097 | |
--Renter-Occupied | 684 | 4,899 | 11,592 | |
Owner-Occupied Values | < 100K | 9 | 334 | 862 |
100-199K | 91 | 903 | 2787 | |
200-299K | 530 | 3841 | 9144 | |
300-399K | 663 | 4890 | 11001 | |
400-499K | 360 | 2325 | 5800 | |
500K+ | 131 | 1767 | 5502 | |
Total Working Age Population | 5,242 | 41,314 | 103,784 | |
In Work Force | 3,822 | 29,984 | 73,521 | |
Not In Work Force | 1,421 | 11,330 | 30,263 | |
Workforce Employed | 3,667 | 28,836 | 69,766 | |
Workforce Unemployed | 154 | 1,148 | 3,741 | |
Civlian Workforce | 3,822 | 29,984 | 73,506 | |
Military Workforce | 0 | 0 | 15 | |
Total Households | 2,469 | 18,958 | 46,689 | |
Family Households | 1,877 | 13,110 | 32,604 | |
Non-Family Households | 592 | 5,848 | 14,085 | |
Married Couple | 1,265 | 9,736 | 24,157 | |
Other Family | 612 | 3,374 | 8,448 | |
Married w/Child | 512 | 4,192 | 10,021 | |
Single Male w/Child | 188 | 416 | 1,018 | |
Single Female w/Child | 121 | 1,184 | 2,906 |
Population Change Last Two Decades - Plus Projection
2000 | % | 2010 | % | 2020 | % | 2030 | |
---|---|---|---|---|---|---|---|
Massachusetts | 6,349,097 | +3 | 6,547,629 | +6 | 6,933,887 | +4 | 7,225,472 |
Bristol County | 534,678 | +3 | 548,285 | +2 | 561,478 | +1 | 567,277 |
Norfolk County | 650,308 | +3 | 670,850 | +7 | 718,394 | +7 | 765,912 |
Plymouth County | 472,822 | +5 | 494,919 | +5 | 518,508 | +3 | 534,464 |
Total Working Age Population:
Total Households:
Total Working Age Population:
Total Households:
Total Working Age Population:
Total Households: