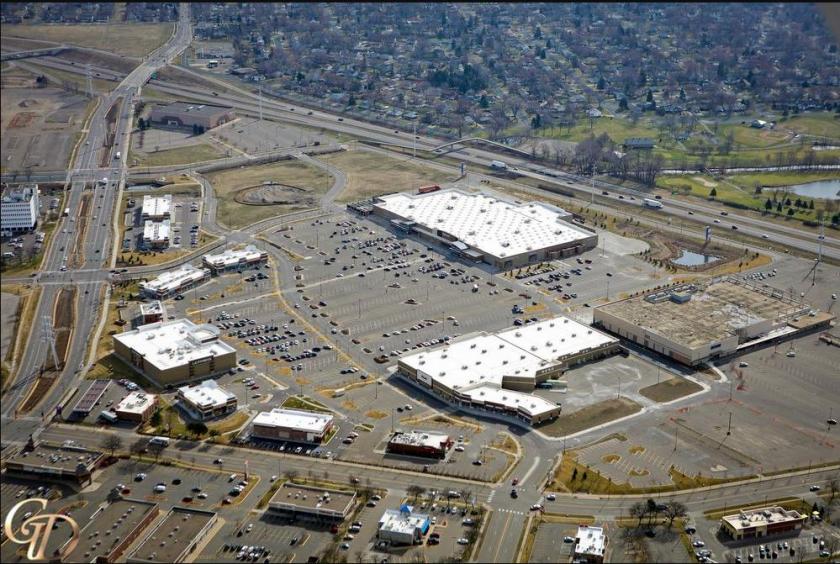
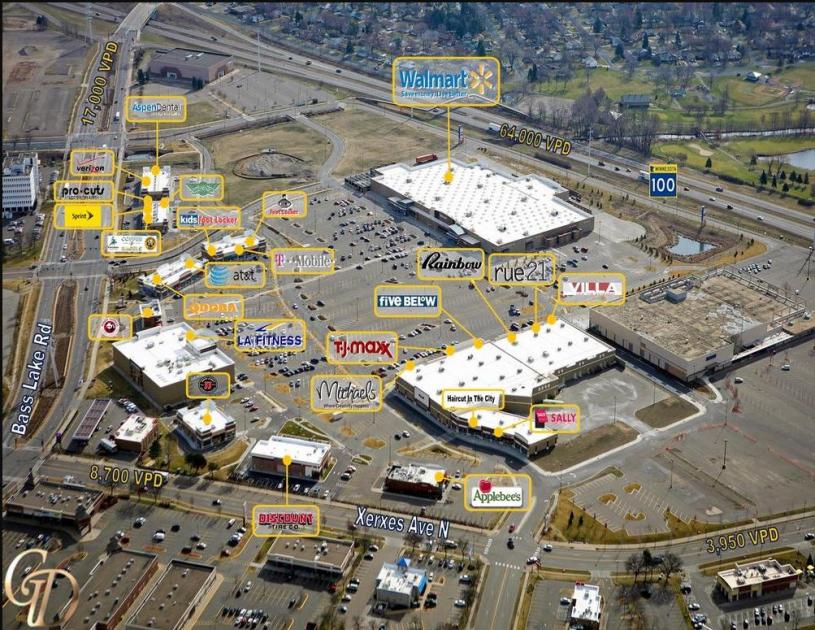
Walmart, Michaels, TJMaxx, Five Below, Rainbow, Rue 21, Villa, LA Fitness, Applebees, Qdoba, Jimmy Johns, Panda Express, Foot Locker, T Mobile, Caribou Coffee, Bruggers Bagels, Sprint and Aspen Dental.CommentsBTS Lots available. Ranging from 0.92-2.87 Ac in size.Shingle Creek Crossing, formerly the Regional Brookdale Mall began development in August of 2011, anchoring Wal-Mart , Sears and LA Fitness. The conversion from mall to Life style/ Community Center has attracted well known retailers includ-ing Michalel’s Arts & Crafts TJ Maxx, Rainbow Appeal, Rue 21, Five Below, Sprint, T-Mobie, Qdoba, Applebee's, and a host of other well established retail chains. In addition to retail store fronts that are for lease, there are pad sites for lease/sale to attract uses including sit down restaurants, retail or medical uses. Though Shingle Creek Crossing has created a revitaliza-tion within the current regional trade area, its goal is to con-tinue to attract quality retailers and service providers that will serve and benefit the community and outlaying cities. With over 121,000 people residing in a 3 mile radius the retailers have experienced great success at Shingle Creek Crossing. The annual household incomes within 3 miles are comparable to many of the neighboring cities. Its proximity along HWY 100 with over 64,000 cars traveling daily is an inherent asset. Bass Lake Road and Xerxes creates a ring road around the development which provides key ac-cess and egress points to make it convenient for patrons to navigate thru the development. Ample parking, pylon signage for retailers are another selling feature. Finally, the city of Brooklyn Center has invested significantly in this project to create an aesthetically appealing outdoor attraction with waterways, ponds and regional trails for biking and walking.