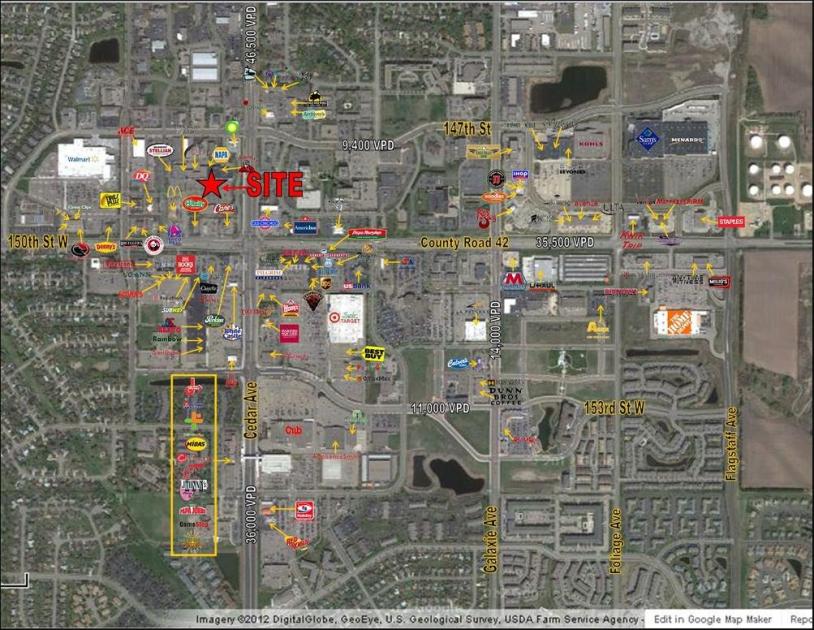
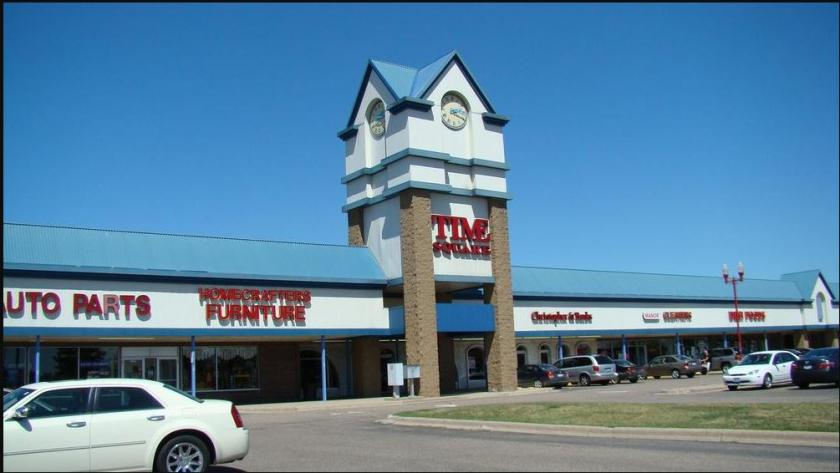
1-Mile | 3-Miles | 5-Miles | ||
---|---|---|---|---|
Total Population | 12,398 | 88,523 | 200,985 | |
Population Median Age | 39 | 38 | 38 | |
Population by Age | 0-9 Yrs | 1618 (13%) | 11884 (13%) | 27273 (13%) |
10-19 Yrs | 1429 (11%) | 12456 (14%) | 27953 (13%) | |
20-29 Yrs | 1474 (11%) | 10255 (11%) | 23471 (11%) | |
30-39 Yrs | 1683 (13%) | 12288 (13%) | 27800 (13%) | |
40-49 Yrs | 1778 (14%) | 10995 (12%) | 26485 (13%) | |
50-59 Yrs | 1767 (14%) | 13488 (15%) | 29985 (14%) | |
60-69 Yrs | 1204 (9%) | 9844 (11%) | 21538 (10%) | |
70+ Yrs | 1444 (11%) | 7313 (8%) | 16479 (8%) | |
Median HH Income | $68,307 | $94,540 | $91,682 | |
Total Household Income | < 24K | 869 (17%) | 2488 (7%) | 6551 (8%) |
25-49K | 1029 (20%) | 4520 (13%) | 11713 (15%) | |
50-74K | 871 (17%) | 5075 (15%) | 11307 (15%) | |
75-99K | 753 (14%) | 5367 (16%) | 11989 (15%) | |
100-199K | 1359 (26%) | 11706 (35%) | 25871 (34%) | |
200K+ | 161 (3%) | 3401 (10%) | 7712 (10%) | |
Highest Education Level | No Diploma | 392 | 2803 | 6542 |
Diploma or GED | 2191 | 10665 | 24764 | |
Some College | 2031 | 11438 | 27119 | |
Assoc. Degree | 1063 | 7127 | 15728 | |
Bachelors Degree | 1970 | 18593 | 41953 | |
Higher Degree | 847 | 8335 | 17879 | |
Total Housing Units | 5,097 | 33,520 | 77,354 | |
--Owner-Occupied | 3,132 | 25,603 | 58,115 | |
--Renter-Occupied | 1,911 | 6,955 | 17,027 | |
Owner-Occupied Values | < 100K | 255 | 1114 | 3441 |
100-199K | 800 | 5528 | 11250 | |
200-299K | 1627 | 9231 | 21740 | |
300-399K | 243 | 5746 | 12732 | |
400-499K | 160 | 2756 | 5944 | |
500K+ | 48 | 1229 | 3009 | |
Total Working Age Population | 9,774 | 68,675 | 156,154 | |
In Work Force | 6,950 | 51,499 | 117,560 | |
Not In Work Force | 2,824 | 17,176 | 38,595 | |
Workforce Employed | 6,616 | 49,716 | 113,221 | |
Workforce Unemployed | 326 | 1,726 | 4,215 | |
Civlian Workforce | 6,941 | 51,442 | 117,436 | |
Military Workforce | 9 | 57 | 124 | |
Total Households | 5,043 | 32,559 | 75,142 | |
Family Households | 3,119 | 24,126 | 54,287 | |
Non-Family Households | 1,924 | 8,433 | 20,856 | |
Married Couple | 2,324 | 19,446 | 43,205 | |
Other Family | 795 | 4,679 | 11,082 | |
Married w/Child | 964 | 8,386 | 18,872 | |
Single Male w/Child | 125 | 743 | 1,917 | |
Single Female w/Child | 310 | 1,950 | 4,930 |
Population Change Last Two Decades - Plus Projection
2000 | % | 2010 | % | 2020 | % | 2030 | |
---|---|---|---|---|---|---|---|
Minnesota | 4,919,479 | +8 | 5,303,925 | +7 | 5,687,161 | +5 | 5,974,304 |
Dakota County | 355,904 | +12 | 398,552 | +9 | 434,203 | +7 | 463,564 |
Hennepin County | 1,116,200 | +3 | 1,152,425 | +12 | 1,294,371 | +9 | 1,407,332 |
Scott County | 89,498 | +45 | 129,928 | +18 | 152,927 | +13 | 172,140 |
Total Working Age Population:
Total Households:
Total Working Age Population:
Total Households:
Total Working Age Population:
Total Households: