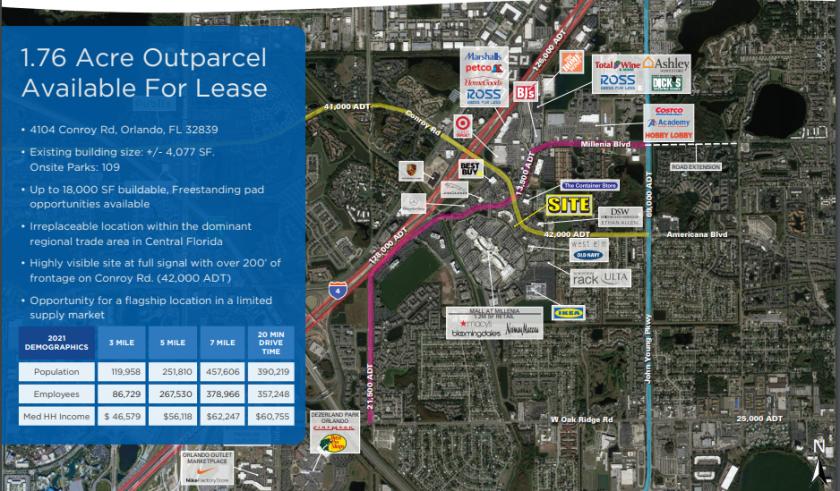
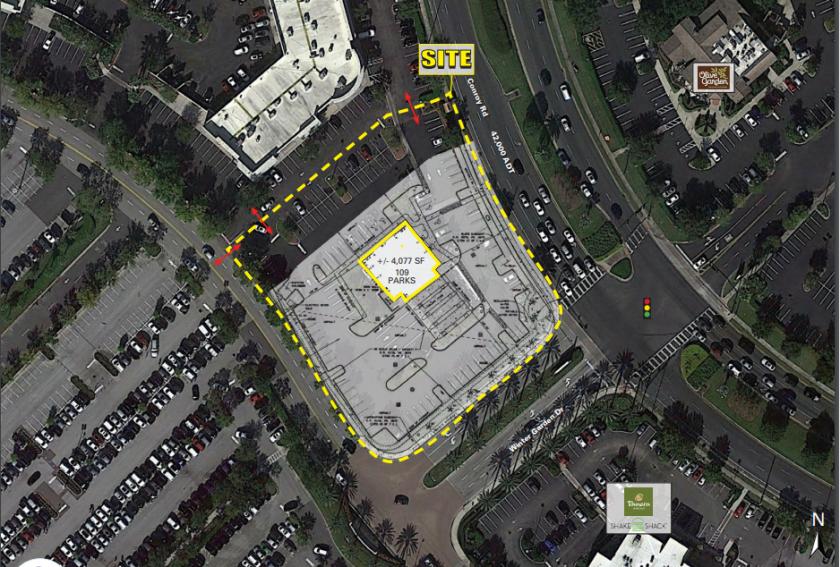
1-Mile | 3-Miles | 5-Miles | ||
---|---|---|---|---|
Total Population | 22,489 | 125,022 | 268,976 | |
Population Median Age | 33 | 34 | 36 | |
Population by Age | 0-9 Yrs | 2731 (12%) | 16104 (12%) | 33136 (12%) |
10-19 Yrs | 2711 (12%) | 13832 (11%) | 29945 (11%) | |
20-29 Yrs | 5156 (22%) | 26055 (20%) | 49938 (18%) | |
30-39 Yrs | 3944 (17%) | 23269 (18%) | 45949 (17%) | |
40-49 Yrs | 3121 (13%) | 16332 (13%) | 34529 (12%) | |
50-59 Yrs | 2385 (10%) | 13167 (10%) | 32472 (12%) | |
60-69 Yrs | 1523 (6%) | 9593 (7%) | 24373 (9%) | |
70+ Yrs | 918 (4%) | 6671 (5%) | 18635 (6%) | |
Median HH Income | $45,277 | $40,478 | $47,033 | |
Total Household Income | < 24K | 1961 (26%) | 12834 (29%) | 24808 (25%) |
25-49K | 2130 (28%) | 13322 (30%) | 26274 (26%) | |
50-74K | 1813 (24%) | 9183 (21%) | 19133 (19%) | |
75-99K | 818 (10%) | 3802 (8%) | 10147 (10%) | |
100-199K | 726 (9%) | 3649 (8%) | 12230 (12%) | |
200K+ | 57 (0%) | 817 (1%) | 4929 (5%) | |
Highest Education Level | No Diploma | 2580 | 14421 | 26015 |
Diploma or GED | 3802 | 24412 | 48863 | |
Some College | 3440 | 17382 | 35151 | |
Assoc. Degree | 1290 | 8554 | 19486 | |
Bachelors Degree | 3266 | 15296 | 39272 | |
Higher Degree | 861 | 5102 | 17019 | |
Total Housing Units | 9,656 | 54,211 | 118,260 | |
--Owner-Occupied | 1,350 | 11,257 | 37,093 | |
--Renter-Occupied | 6,155 | 32,349 | 60,427 | |
Owner-Occupied Values | < 100K | 362 | 3902 | 7343 |
100-199K | 744 | 4379 | 11017 | |
200-299K | 157 | 1644 | 7177 | |
300-399K | 56 | 684 | 5171 | |
400-499K | 13 | 282 | 2236 | |
500K+ | 18 | 367 | 4149 | |
Total Working Age Population | 18,134 | 100,171 | 217,241 | |
In Work Force | 12,865 | 69,377 | 148,972 | |
Not In Work Force | 5,270 | 30,794 | 68,268 | |
Workforce Employed | 12,346 | 65,241 | 140,239 | |
Workforce Unemployed | 472 | 3,975 | 8,499 | |
Civlian Workforce | 12,818 | 69,216 | 148,738 | |
Military Workforce | 46 | 161 | 234 | |
Total Households | 7,505 | 43,607 | 97,521 | |
Family Households | 4,596 | 25,326 | 58,029 | |
Non-Family Households | 2,908 | 18,281 | 39,491 | |
Married Couple | 2,486 | 13,021 | 33,846 | |
Other Family | 2,110 | 12,305 | 24,183 | |
Married w/Child | 1,025 | 5,466 | 13,340 | |
Single Male w/Child | 257 | 1,329 | 2,906 | |
Single Female w/Child | 738 | 5,015 | 9,545 |
Population Change Last Two Decades - Plus Projection
2000 | % | 2010 | % | 2020 | % | 2030 | |
---|---|---|---|---|---|---|---|
Florida | 15,982,378 | +18 | 18,801,310 | +14 | 21,517,610 | +13 | 24,340,457 |
Lake County | 210,528 | +41 | 297,052 | +21 | 360,739 | +21 | 437,201 |
Orange County | 896,344 | +28 | 1,145,956 | +24 | 1,415,511 | +20 | 1,693,977 |
Total Working Age Population:
Total Households:
Total Working Age Population:
Total Households:
Total Working Age Population:
Total Households: