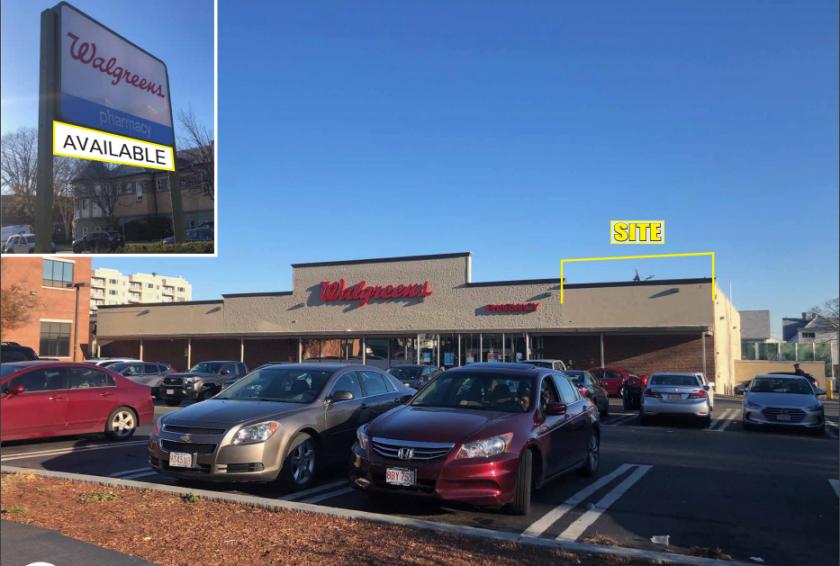
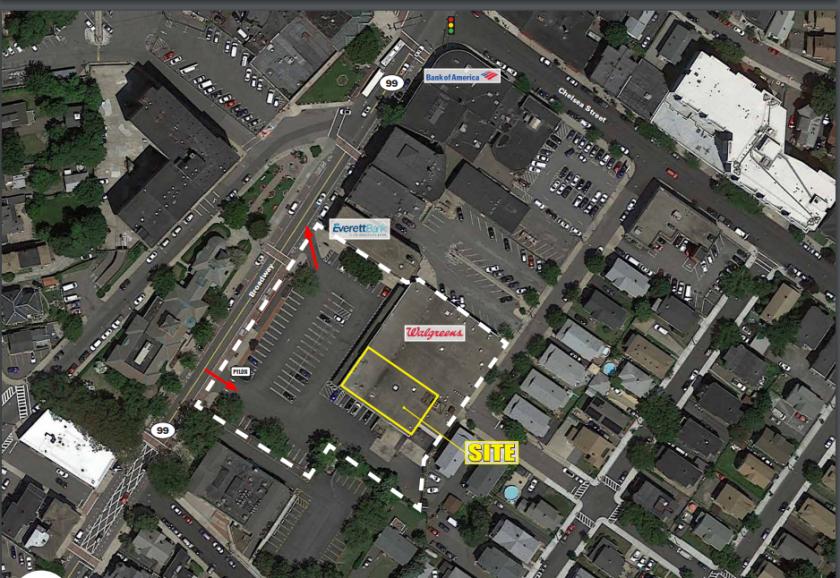
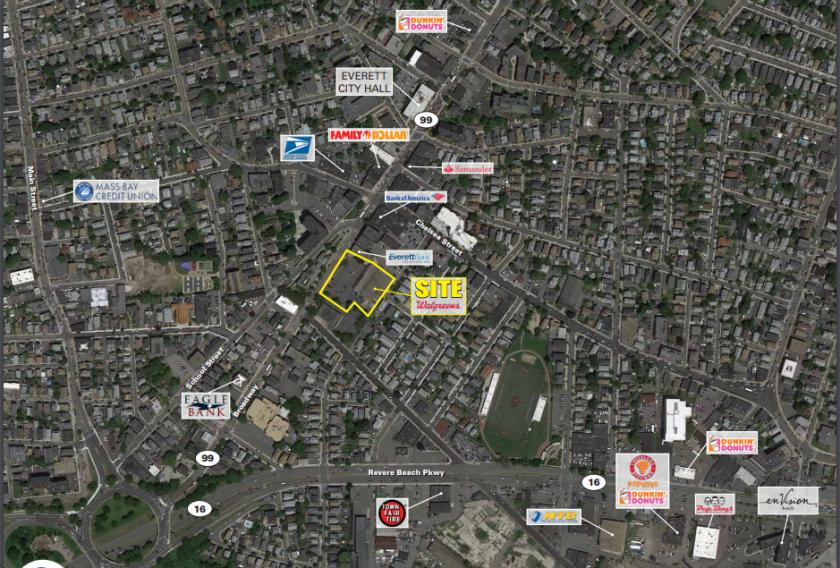
1-Mile | 3-Miles | 5-Miles | ||
---|---|---|---|---|
Total Population | 43,267 | 373,542 | 824,536 | |
Population Median Age | 36 | 37 | 37 | |
Population by Age | 0-9 Yrs | 5235 (12%) | 41904 (11%) | 76267 (9%) |
10-19 Yrs | 4995 (11%) | 34066 (9%) | 83997 (10%) | |
20-29 Yrs | 7514 (17%) | 72363 (19%) | 185593 (22%) | |
30-39 Yrs | 7263 (16%) | 72419 (19%) | 152659 (18%) | |
40-49 Yrs | 6113 (14%) | 46371 (12%) | 93607 (11%) | |
50-59 Yrs | 5728 (13%) | 44431 (11%) | 91561 (11%) | |
60-69 Yrs | 3834 (8%) | 32900 (8%) | 72914 (8%) | |
70+ Yrs | 2584 (5%) | 29088 (7%) | 67937 (8%) | |
Median HH Income | $65,215 | $73,622 | $84,437 | |
Total Household Income | < 24K | 2644 (17%) | 27198 (18%) | 60912 (18%) |
25-49K | 3276 (21%) | 24907 (17%) | 47902 (14%) | |
50-74K | 2857 (18%) | 21762 (14%) | 42637 (12%) | |
75-99K | 2197 (14%) | 17243 (11%) | 36792 (11%) | |
100-199K | 3562 (23%) | 39239 (26%) | 91136 (27%) | |
200K+ | 706 (4%) | 15096 (10%) | 51304 (15%) | |
Highest Education Level | No Diploma | 5476 | 43126 | 64566 |
Diploma or GED | 10244 | 69132 | 116936 | |
Some College | 5623 | 35892 | 66153 | |
Assoc. Degree | 1774 | 12706 | 24953 | |
Bachelors Degree | 4471 | 59830 | 155293 | |
Higher Degree | 2361 | 49574 | 157117 | |
Total Housing Units | 16,310 | 155,988 | 360,245 | |
--Owner-Occupied | 5,440 | 54,795 | 131,303 | |
--Renter-Occupied | 9,802 | 90,650 | 199,379 | |
Owner-Occupied Values | < 100K | 148 | 1353 | 2658 |
100-199K | 283 | 1370 | 2718 | |
200-299K | 599 | 5407 | 9887 | |
300-399K | 1529 | 11424 | 22248 | |
400-499K | 1325 | 11254 | 21051 | |
500K+ | 1555 | 23987 | 72741 | |
Total Working Age Population | 34,869 | 309,877 | 710,551 | |
In Work Force | 25,484 | 225,064 | 505,284 | |
Not In Work Force | 9,385 | 84,813 | 205,267 | |
Workforce Employed | 24,193 | 214,941 | 481,246 | |
Workforce Unemployed | 1,290 | 9,557 | 22,720 | |
Civlian Workforce | 25,483 | 224,497 | 503,966 | |
Military Workforce | 0 | 566 | 1,318 | |
Total Households | 15,242 | 145,445 | 330,682 | |
Family Households | 10,024 | 80,677 | 164,025 | |
Non-Family Households | 5,218 | 64,768 | 166,658 | |
Married Couple | 5,952 | 53,039 | 117,327 | |
Other Family | 4,072 | 27,639 | 46,698 | |
Married w/Child | 2,628 | 21,774 | 44,388 | |
Single Male w/Child | 459 | 3,103 | 4,979 | |
Single Female w/Child | 1,514 | 9,329 | 15,721 |
Population Change Last Two Decades - Plus Projection
2000 | % | 2010 | % | 2020 | % | 2030 | |
---|---|---|---|---|---|---|---|
Massachusetts | 6,349,097 | +3 | 6,547,629 | +6 | 6,933,887 | +4 | 7,225,472 |
Essex County | 723,419 | +3 | 743,159 | +6 | 790,035 | +3 | 816,022 |
Middlesex County | 1,465,396 | +3 | 1,503,085 | +7 | 1,613,961 | +5 | 1,686,641 |
Norfolk County | 650,308 | +3 | 670,850 | +7 | 718,394 | +7 | 765,912 |
Plymouth County | 472,822 | +5 | 494,919 | +5 | 518,508 | +3 | 534,464 |
Suffolk County | 689,807 | +5 | 722,023 | +14 | 821,840 | +10 | 900,586 |
Total Working Age Population:
Total Households:
Total Working Age Population:
Total Households:
Total Working Age Population:
Total Households: