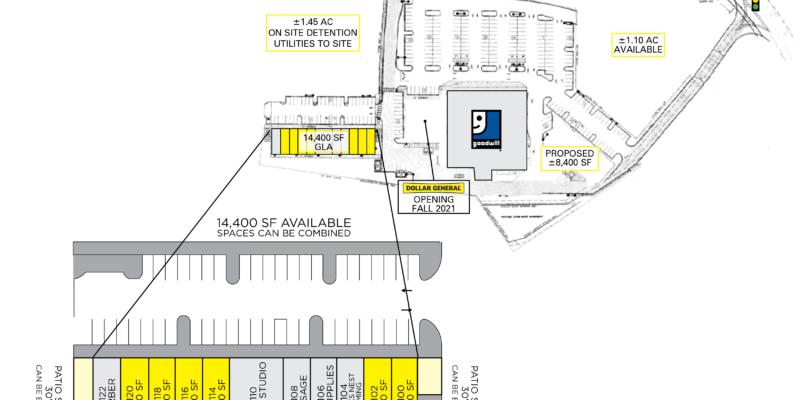
1,200 – 4,800 SF with 60’ depth
Restaurant space with outdoor patio
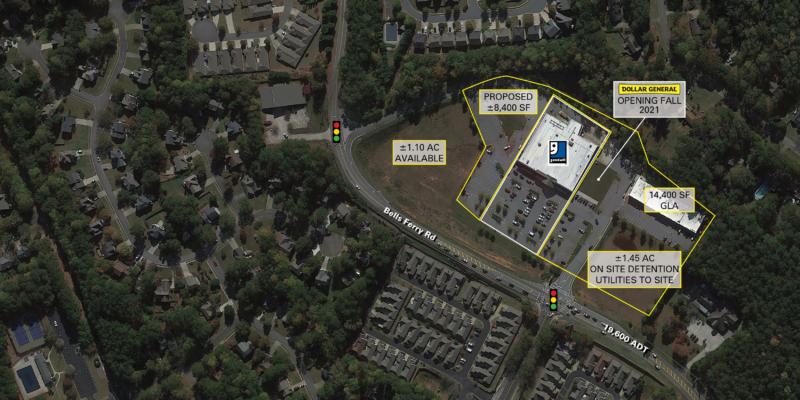
±8,400 SF Pad
±1.10 Acre Outparcel
±1.45 Acre Outparcel
Dollar General opening Late Spring 2021
Neighborhood center located on Bells Ferry Road with a traffic signal at the main entrance
Site is contiguous to new Goodwill Retail Store
Dense, upper middle-class residential corridor
Surrounded by award winning schools including Etowah HS, E.T. Booth MS and Boston ES
Traffic Count 19,600 ADT on Bells Ferry Rd
No part of this information may be copied, reproduced, repurposed, or screen-captured for any commercial purpose without prior written authorization from MyEListing.
While we strive to provide the most accurate information, all listing information, and demographic data, is provided by third-parties. As such, MyEListing will not be responsible for the accuracy of the information. It is strongly recommended that you verify all information with the listing agent, and any relevant agencies, prior to making any decisions.
What is the building size of this commercial Retail property?
The size of this multi-unit property varies between 1200 - 4800 square feet
What kind of Retail is the propery at 6721 Bells Ferry Road?
The property at 6721 Bells Ferry Road Woodstock, GA 30189 is listed as a Other Retail Retail property
What is the population within 1 mile of 6721 Bells Ferry Road in Woodstock?
The population within 1 mile of 6721 Bells Ferry Road Woodstock, GA 30189 is 5,701 people.
Who do I contact for questions about 6721 Bells Ferry Road?
You should contact the listing agent,
Bre Clagett, for any details regarding this commercial listing.