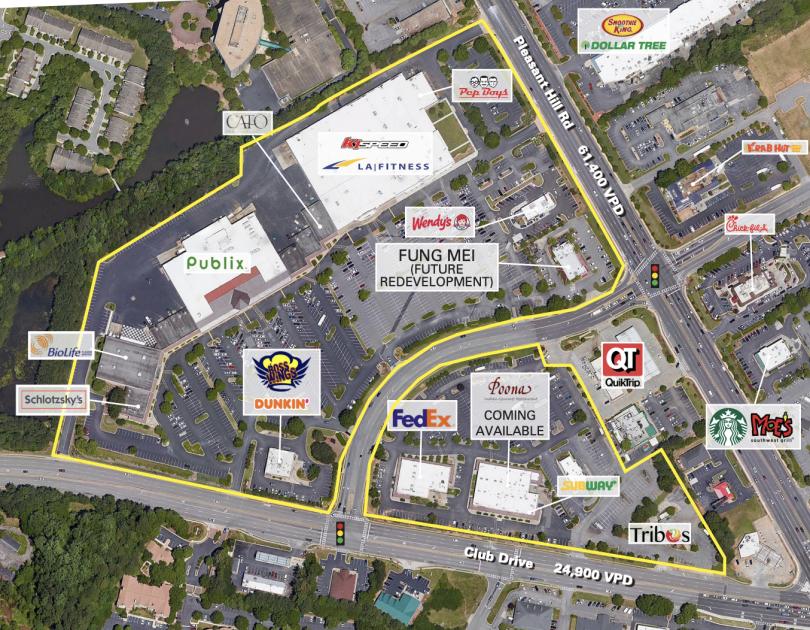
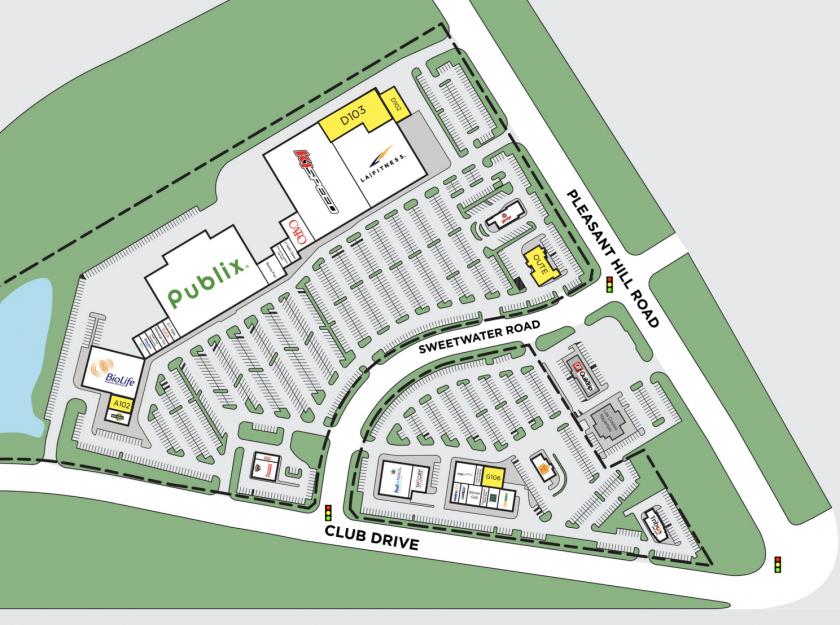
1-Mile | 3-Miles | 5-Miles | ||
---|---|---|---|---|
Total Population | 12,898 | 102,472 | 247,899 | |
Population Median Age | 31 | 33 | 34 | |
Population by Age | 0-9 Yrs | 2347 (18%) | 16221 (15%) | 36453 (14%) |
10-19 Yrs | 1481 (11%) | 14579 (14%) | 38818 (15%) | |
20-29 Yrs | 2731 (21%) | 16781 (16%) | 35690 (14%) | |
30-39 Yrs | 2344 (18%) | 17142 (16%) | 39121 (15%) | |
40-49 Yrs | 1622 (12%) | 14798 (14%) | 36012 (14%) | |
50-59 Yrs | 1325 (10%) | 11218 (10%) | 29641 (11%) | |
60-69 Yrs | 598 (4%) | 7002 (6%) | 19401 (7%) | |
70+ Yrs | 451 (3%) | 4730 (4%) | 12761 (5%) | |
Median HH Income | $44,779 | $51,228 | $57,366 | |
Total Household Income | < 24K | 1167 (22%) | 6994 (20%) | 14242 (17%) |
25-49K | 1628 (31%) | 9775 (28%) | 20704 (25%) | |
50-74K | 1315 (25%) | 8098 (23%) | 17514 (21%) | |
75-99K | 545 (10%) | 4255 (12%) | 10632 (13%) | |
100-199K | 347 (6%) | 4388 (12%) | 13763 (17%) | |
200K+ | 99 (1%) | 862 (2%) | 3926 (4%) | |
Highest Education Level | No Diploma | 1301 | 12691 | 28794 |
Diploma or GED | 2121 | 16690 | 38153 | |
Some College | 1676 | 10500 | 25887 | |
Assoc. Degree | 573 | 5557 | 13929 | |
Bachelors Degree | 1535 | 12714 | 32724 | |
Higher Degree | 727 | 5656 | 15718 | |
Total Housing Units | 5,714 | 37,015 | 86,148 | |
--Owner-Occupied | 905 | 12,928 | 40,188 | |
--Renter-Occupied | 4,195 | 21,444 | 40,593 | |
Owner-Occupied Values | < 100K | 160 | 1564 | 3473 |
100-199K | 632 | 7479 | 19663 | |
200-299K | 83 | 2993 | 9709 | |
300-399K | 16 | 550 | 3603 | |
400-499K | 1 | 97 | 1332 | |
500K+ | 13 | 246 | 2409 | |
Total Working Age Population | 9,550 | 76,973 | 187,385 | |
In Work Force | 7,290 | 54,206 | 129,097 | |
Not In Work Force | 2,260 | 22,768 | 58,288 | |
Workforce Employed | 6,838 | 51,732 | 123,376 | |
Workforce Unemployed | 450 | 2,442 | 5,607 | |
Civlian Workforce | 7,288 | 54,174 | 128,983 | |
Military Workforce | 2 | 31 | 114 | |
Total Households | 5,101 | 34,371 | 80,781 | |
Family Households | 2,687 | 22,818 | 57,150 | |
Non-Family Households | 2,414 | 11,554 | 23,632 | |
Married Couple | 1,622 | 14,583 | 39,251 | |
Other Family | 1,064 | 8,235 | 17,899 | |
Married w/Child | 891 | 7,501 | 19,453 | |
Single Male w/Child | 109 | 894 | 2,055 | |
Single Female w/Child | 510 | 3,359 | 7,637 |
Population Change Last Two Decades - Plus Projection
2000 | % | 2010 | % | 2020 | % | 2030 | |
---|---|---|---|---|---|---|---|
Georgia | 8,186,453 | +18 | 9,687,653 | +12 | 10,833,472 | +13 | 12,292,423 |
DeKalb County | 665,865 | +4 | 691,893 | +15 | 793,154 | +19 | 944,045 |
Fulton County | 816,006 | +13 | 920,581 | +19 | 1,099,181 | +18 | 1,300,861 |
Gwinnett County | 588,448 | +37 | 805,321 | +21 | 971,145 | +21 | 1,175,358 |
Total Working Age Population:
Total Households:
Total Working Age Population:
Total Households:
Total Working Age Population:
Total Households: