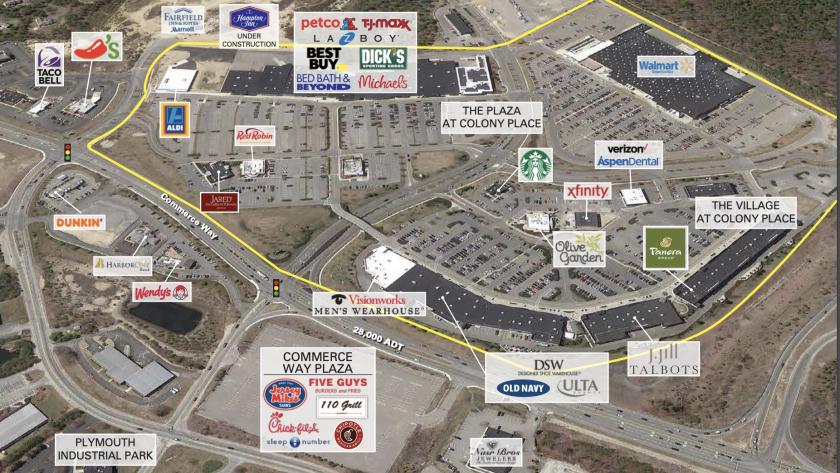
1-Mile | 3-Miles | 5-Miles | ||
---|---|---|---|---|
Total Population | 2,545 | 35,636 | 70,742 | |
Population Median Age | 42 | 42 | 43 | |
Population by Age | 0-9 Yrs | 273 (10%) | 3292 (9%) | 6786 (9%) |
10-19 Yrs | 320 (12%) | 4271 (11%) | 8095 (11%) | |
20-29 Yrs | 307 (12%) | 4463 (12%) | 8393 (11%) | |
30-39 Yrs | 284 (11%) | 4003 (11%) | 7713 (10%) | |
40-49 Yrs | 240 (9%) | 4554 (12%) | 9106 (12%) | |
50-59 Yrs | 428 (16%) | 5137 (14%) | 10536 (14%) | |
60-69 Yrs | 272 (10%) | 5327 (14%) | 10059 (14%) | |
70+ Yrs | 421 (16%) | 4590 (12%) | 10054 (14%) | |
Median HH Income | $54,167 | $75,295 | $82,487 | |
Total Household Income | < 24K | 246 (23%) | 2338 (16%) | 3874 (14%) |
25-49K | 242 (23%) | 2811 (19%) | 4758 (17%) | |
50-74K | 118 (11%) | 2083 (14%) | 4008 (14%) | |
75-99K | 139 (13%) | 2112 (14%) | 3941 (14%) | |
100-199K | 215 (20%) | 3955 (27%) | 7788 (28%) | |
200K+ | 68 (6%) | 1215 (8%) | 3272 (11%) | |
Highest Education Level | No Diploma | 94 | 1499 | 2923 |
Diploma or GED | 680 | 7899 | 14771 | |
Some College | 377 | 4935 | 8934 | |
Assoc. Degree | 208 | 2649 | 4805 | |
Bachelors Degree | 331 | 6046 | 12493 | |
Higher Degree | 134 | 2831 | 7484 | |
Total Housing Units | 1,062 | 16,123 | 31,014 | |
--Owner-Occupied | 734 | 9,512 | 19,867 | |
--Renter-Occupied | 294 | 5,002 | 7,775 | |
Owner-Occupied Values | < 100K | 45 | 460 | 770 |
100-199K | 181 | 801 | 1443 | |
200-299K | 122 | 1639 | 3170 | |
300-399K | 201 | 3328 | 5805 | |
400-499K | 97 | 1668 | 3519 | |
500K+ | 88 | 1616 | 5159 | |
Total Working Age Population | 2,044 | 29,552 | 58,600 | |
In Work Force | 1,142 | 19,747 | 38,566 | |
Not In Work Force | 902 | 9,805 | 20,034 | |
Workforce Employed | 1,049 | 18,683 | 36,573 | |
Workforce Unemployed | 93 | 1,020 | 1,925 | |
Civlian Workforce | 1,142 | 19,703 | 38,498 | |
Military Workforce | 0 | 44 | 68 | |
Total Households | 1,028 | 14,514 | 27,642 | |
Family Households | 735 | 9,040 | 18,080 | |
Non-Family Households | 293 | 5,474 | 9,561 | |
Married Couple | 425 | 6,598 | 14,016 | |
Other Family | 309 | 2,442 | 4,064 | |
Married w/Child | 74 | 2,163 | 4,663 | |
Single Male w/Child | 40 | 453 | 766 | |
Single Female w/Child | 150 | 846 | 1,130 |
Population Change Last Two Decades - Plus Projection
2000 | % | 2010 | % | 2020 | % | 2030 | |
---|---|---|---|---|---|---|---|
Massachusetts | 6,349,097 | +3 | 6,547,629 | +6 | 6,933,887 | +4 | 7,225,472 |
Barnstable County | 222,230 | -3 | 215,888 | -2 | 210,930 | -5 | 199,466 |
Bristol County | 534,678 | +3 | 548,285 | +2 | 561,478 | +1 | 567,277 |
Norfolk County | 650,308 | +3 | 670,850 | +7 | 718,394 | +7 | 765,912 |
Plymouth County | 472,822 | +5 | 494,919 | +5 | 518,508 | +3 | 534,464 |
Total Working Age Population:
Total Households:
Total Working Age Population:
Total Households:
Total Working Age Population:
Total Households: