Industrial Properties
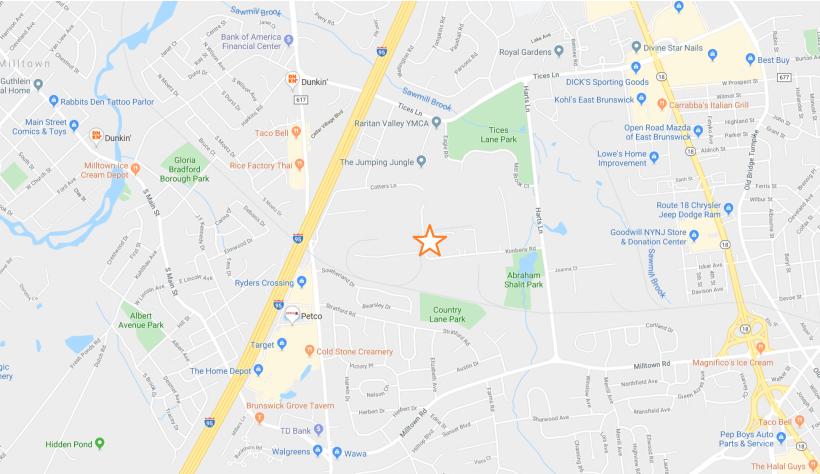
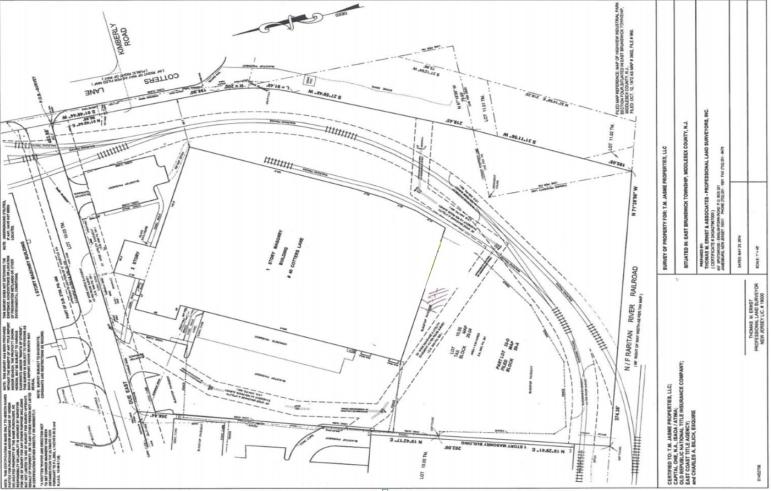
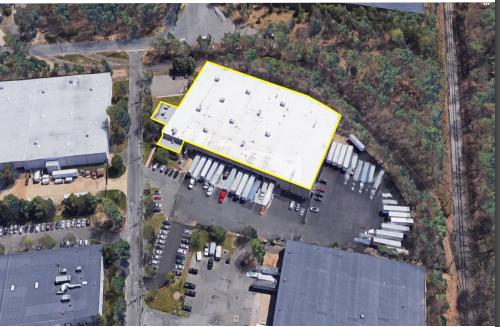
40B Cotters Lane East Brunswick, NJ 08816
40B Cotters Lane East Brunswick, NJ 08816
Details & Description
Listing Agents

Joe D'Agostino
O: 732-545-1850
M: 732-690-6339
joe@lancebram.com
O: 732-545-1850
M: 732-690-6339
joe@lancebram.com
While we strive to provide the most accurate information, all listing information, and demographic data, is provided by third-parties. As such, MyEListing will not be responsible for the accuracy of the information. It is strongly recommended that you verify all information with the listing agent, and any relevant agencies, prior to making any decisions.