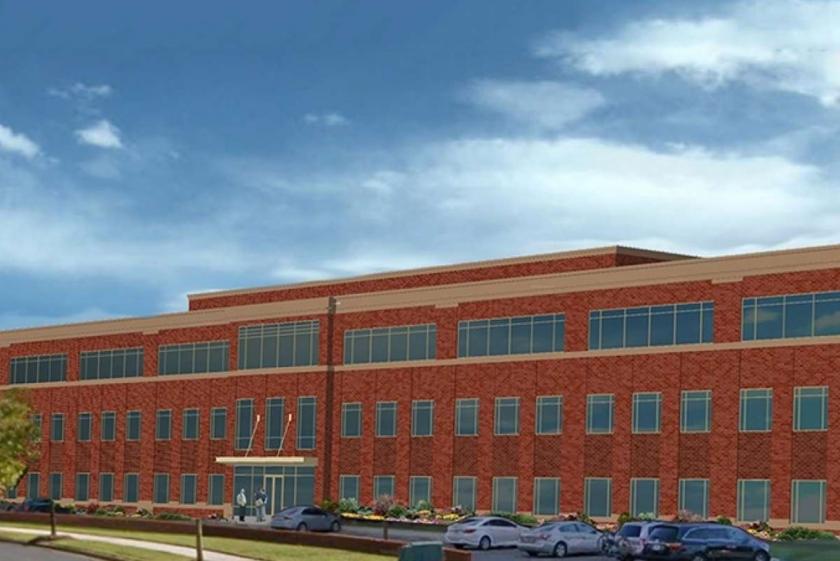
Modern, accessible, and in the middle of it all.
With NorthPointe 5’s flexible floor plan, you can efficiently customize your layout to create effective space solutions for your business. And our unbeatable location offers you and your employees easy access to the interstate, the area’s most desirable residential communities and school systems, popular retail, and Lake Norman.
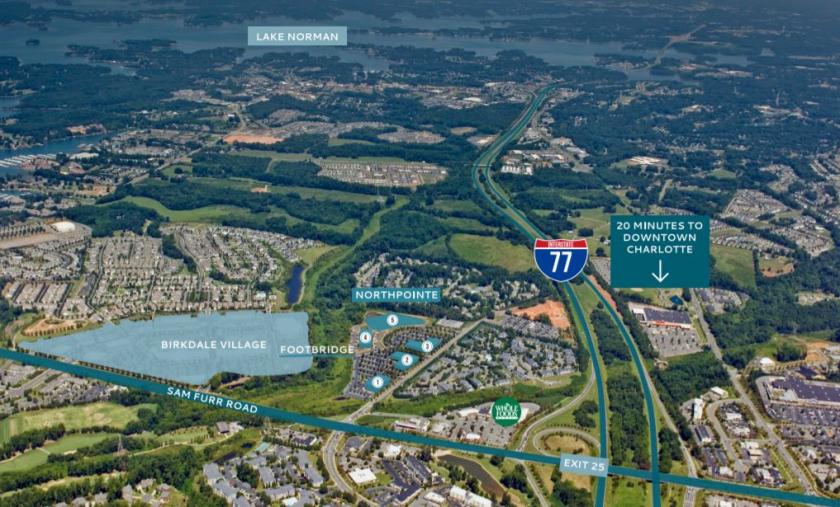
50,000 – 75,000 SF of Class A office space in the heart of North Charlotte & Huntersville
Steps away via footbridge from Birkdale Village & one stoplight away from I-77 at exit 25
Stable and well-capitalized ownership
12 month delivery
Efficient & quick lease execution to meet tenant’s relocation schedules
Branding & signage opportunities
Ample Parking
No part of this information may be copied, reproduced, repurposed, or screen-captured for any commercial purpose without prior written authorization from MyEListing.
While we strive to provide the most accurate information, all listing information, and demographic data, is provided by third-parties. As such, MyEListing will not be responsible for the accuracy of the information. It is strongly recommended that you verify all information with the listing agent, and any relevant agencies, prior to making any decisions.
What is the building size of this commercial Office property?
The size of this multi-unit property varies between 50000 - 75000 square feet
What kind of Office is the propery at 8935 Northpointe Executive Park Dr?
The property at 8935 Northpointe Executive Park Dr Huntersville, NC 28078 is listed as a Professional Office property
What is the population within 1 mile of 8935 Northpointe Executive Park Dr in Huntersville?
The population within 1 mile of 8935 Northpointe Executive Park Dr Huntersville, NC 28078 is 8,573 people.
Who do I contact for questions about 8935 Northpointe Executive Park Dr?
You should contact the listing agent,
Jennifer Kurz, for any details regarding this commercial listing.